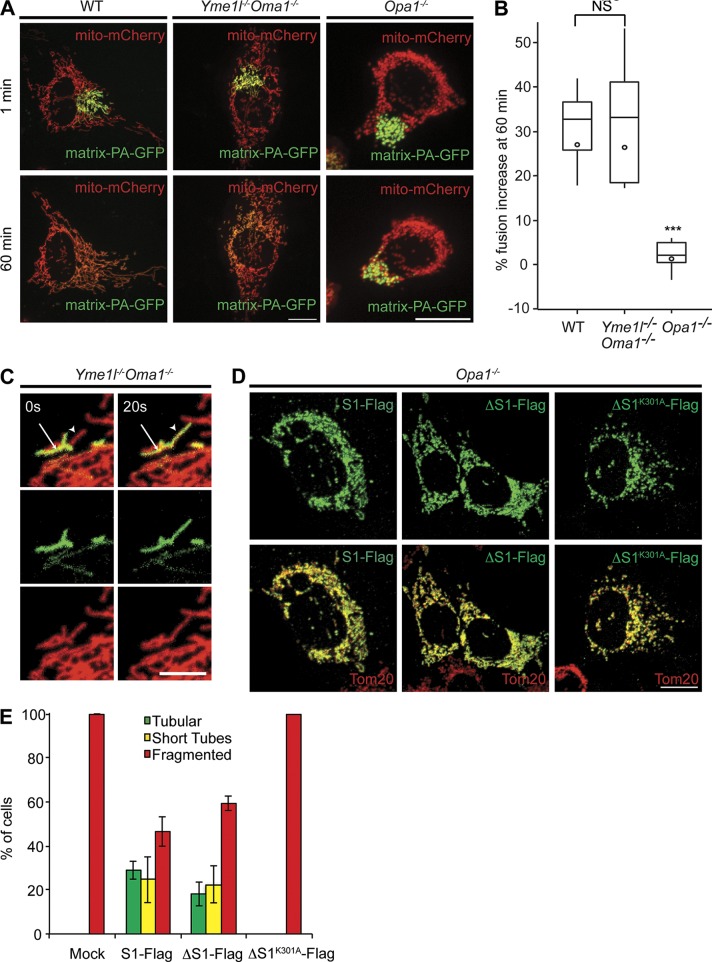
Figure 2.
OPA1 processing is dispensable for mitochondrial fusion. (A and B) Photoactivatable GFP (matrix-PA-GFP) and mito-mCherry both targeted to the mitochondrial matrix were expressed in WT, Yme1l−/−Oma1−/−, and Opa1−/− MEFs (A). Fusion was monitored by the time-dependent dilution and redistribution of PA-GFP fluorescence (top, 1 min; bottom, 60 min). Bars, 15 µm. (B) Quantification of mitochondrial fusion. Results are represented in the form of a box plot: boxes represent data between the 25th and 75th percentiles, lines extend between the 10th and 90th percentiles, the horizontal line indicates the median, and the circle indicates the mean value (n ≥ 14; Yme1l−/−Oma1−/− vs. WT, P = 0.8; Yme1l−/−Oma1−/− vs. Opa1−/−, P = 1.6 × 10⁻¹²; WT vs. Opa1−/−, P = 4.6 × 10⁻⁸; ***, P ≤ 0.001). (C) Visualization of individual fusion events in Yme1l−/−Oma1−/− MEFs using matrix-PA-GFP and mito-mCherry. The arrowheads indicate mitochondria that have acquired photoactivated GFP due to fusion with photoactivated mitochondria. Bar, 5 µm. (D) Mitochondrial morphology in Opa1−/− MEFs expressing cleavable or noncleavable OPA1 forms. Flag-tagged variants of human OPA1 isoform 1 (S1-Flag), isoform 1 lacking the S1 site (ΔS1-Flag), or ΔS1-FlagK301A were transiently expressed in Opa1−/− cells. The mitochondrial network was visualized using a TOM20-specific antibody. Bar, 15 µm. (E) Quantification of three independent experiments (error bars indicate mean ± SD), n ≥ 100.

