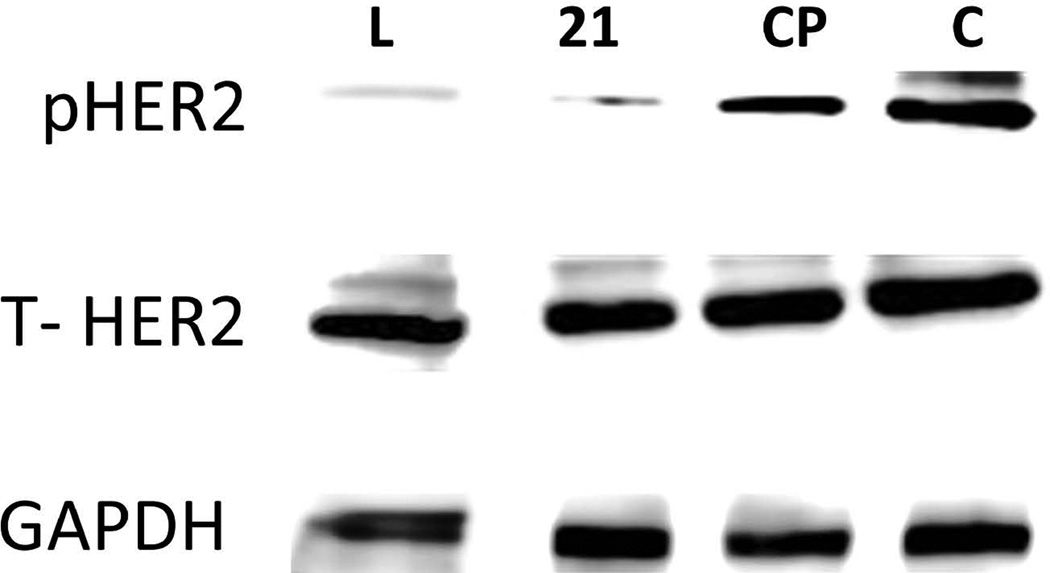
FIGURE 4.
Western blot analysis of phosphorylated HER2. BT-474 cells that overexpress HER2 protein upon treatment with compound 21 (1 µM) and lapatinib (0.07 µM). The visualization of GAPDH was used to ensure equal sample loading in each lane. Phosphorylation was detected using p-HER2 antibody. CP is for control compound and C is for control without any treatment. Total HER2 protein is also shown.

