
Figure 6.
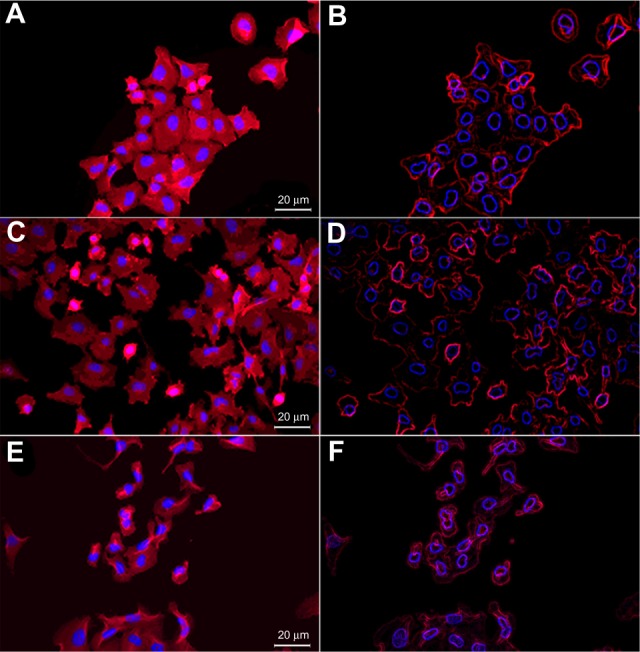
Fluorescence microscopy (FM) images of free shikonin (SHK) effects in OVCAR-5 cells.
Notes: (A) FM image of the untreated cells. (B) Stylized image of the untreated cells. (C) FM image of the treated cells with 5.0 μM SHK. (D) Stylized image of the treated cells with 10.0 μM SHK. (E) FM image of the treated cells with 20 μM SHK. (F) Stylized image of the treated cells with 20.0 μM SHK.