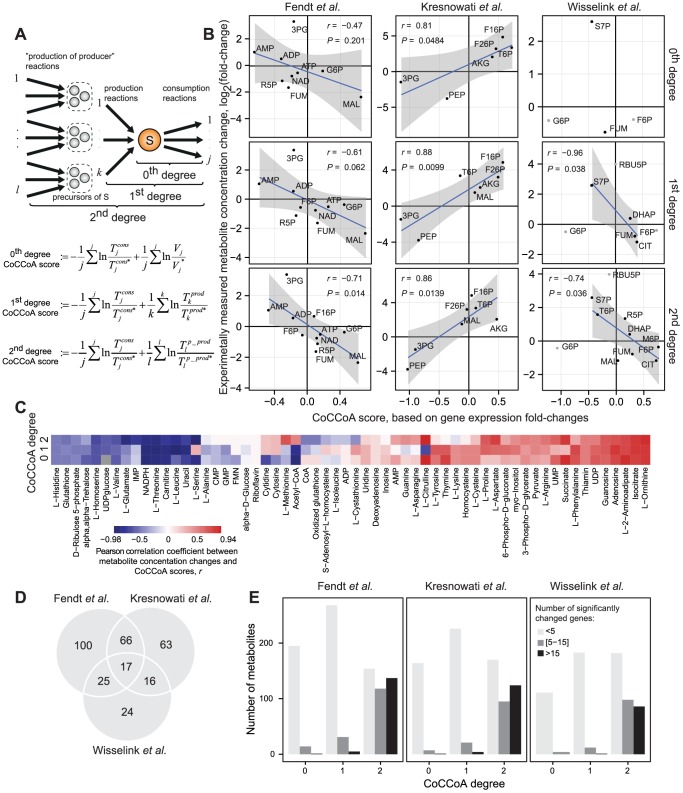
Figure 3. Metabolite concentration changes are correlated with CoCCoA scores.
A) Equations illustrating the calculations of CoCCoA scores of different degrees (Main text, Figure S5). B) Correlations between experimentally measured metabolite concentration changes and CoCCoA scores for the three pairwise comparison datasets [3], [23], [30]. Note that the number of data points that can be tested varies for each coupling degree as the number of genes included in the analysis changes with the degree of the CoCCoA equation (see main text). Metabolites marked in gray could not be included in the analysis as the directions of the fluxes linked to them were altered between the growths on two different carbon sources [30]. C) Pearson correlation coefficients comparing experimentally measured metabolite concentration changes and CoCCoA scores for the metabolic cycle study [9]. D) Overlap between the significantly expressed genes in the three pairwise comparison case studies. Only genes that were used for the calculation of CoCCoA scores are included. E) Number of genes used in the CoCCoA score calculations increase with the increasing model degree. 3PG = 3-Phospho-D-glycerate; G6P = Glucose 6-phosphate; F26P = Fructose 2,6-bisphosphate; F16P = Fructose 1,6-bisphosphate; FUM = Fumarate; CIT = Citrate; MAL = Malate; AKG = alpha-Ketoglutarate; T6P = Trehalose 6-phosphate; PEP = Phosphoenolpyruvate; S7P = Sedoheptulose 7-phosphate; RBU5P = Ribulose 5-phosphate; R5P = Ribose 5-phosphate; DHAP = dihydroxyacetone phosphate; M6P = Mannose 6-phosphate.

