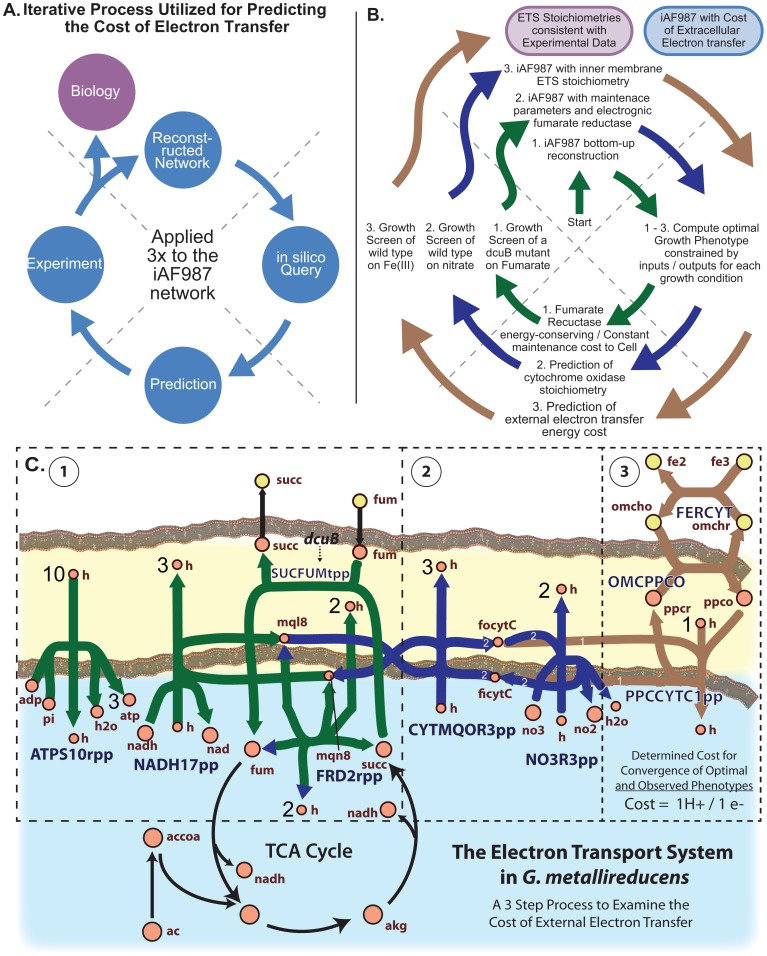
Figure 3. A model-driven analysis of the electron transport system in G. metallireducens.
A) schematic of the iterative loop process common to model-driven analyses, and (B) the process applied to examine the cost of the electron transport system in G. metallireducens. C) Map of the updated ETS in the iAF987 reconstruction. The functional states of the network components during internal electron transfer to fumarate are shown in green (facilitated by the dcuB strain), additional components active during internal transfer to nitrate are shown in blue, and additional components during external electron transfer (Fe respiration) are shown in brown. Note that the fumarate reductase (FRD2rpp) operates in opposite directions depending on whether the electron acceptor is fumarate or nitrate/Fe(III). Also note that nitrate reductase (NO3R3pp) is not used when Fe(III) is the electron acceptor. Abbreviations are defined in Dataset S2. The process was started with the bottom-up reconstruction of the updated metabolic network. At each cycle around the loop, optimal performance was calculated as different components of the ETS were isolated, compared to experimental data, and then incorporated into the reconstruction. Ultimately, the final product is a reconstructed ETS consistent with experimental data and an estimate of the cost associated with transferring electrons from the internal membrane cytochrome (focytC) to the extracellular electron acceptor Fe(III) (fe3).

