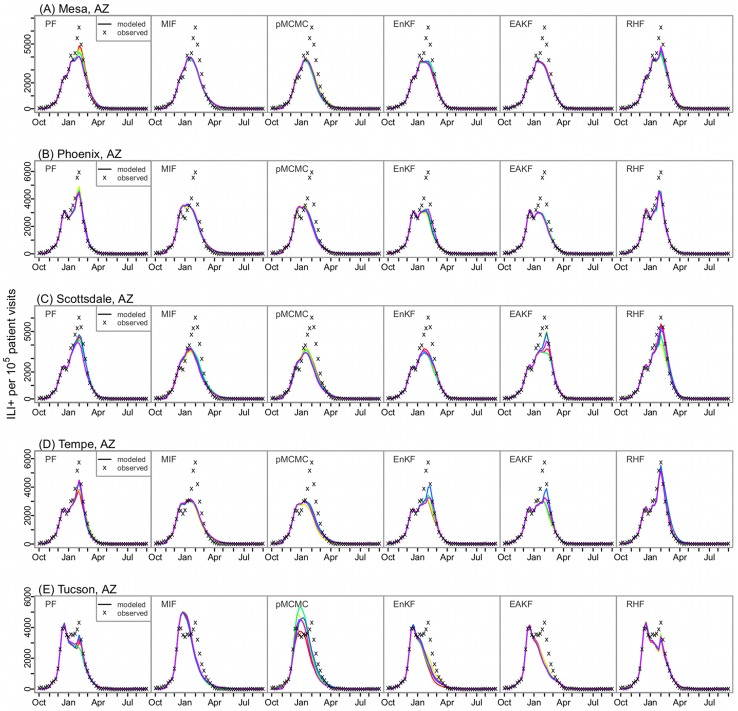
Figure 3. Fitting multimodal outbreaks.
The model-filter frameworks were tested with historical ILI+ time series collected in the 2010–11 season from 5 cities in Arizona: (A) Mesa, (B) Phoenix, (C) Scottsdale, (D) Tempe, and (E) Tucson; all ILI+ times series had multiple peaks of varying magnitudes; each model-filter framework was run repeatedly 5 times; each colored line represents one run; the ‘x’ points are the observed weekly ILI+ data.

