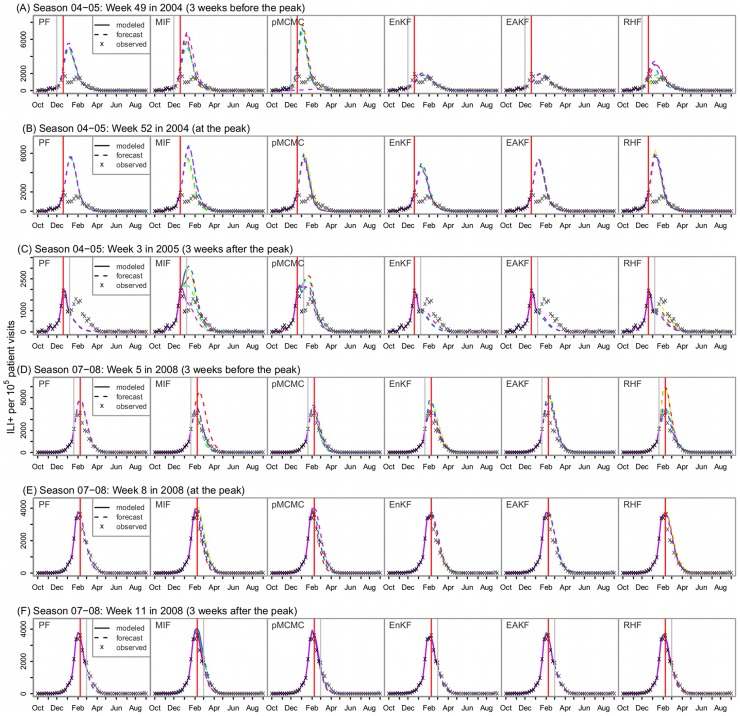
Figure 5. Predicted ILI+ time series for New York City in the 2004–05 (A–C) and 2007–08 seasons (D–F).
Solid lines (5 lines from five repeated runs for each filter) are modeled based on observations during the training period, and the dashed lines are the forecasts; Red vertical lines indicate the observed peak, and grey vertical lines mark the week the forecasts are made.

