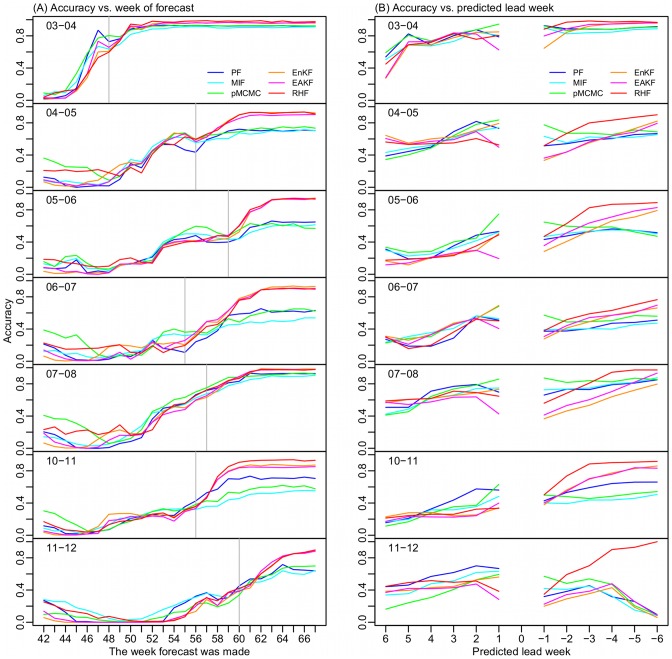
Figure 6. Peak timing prediction accuracy.
(A) Accuracy plotted as a function of forecast initiation week; numbers greater than 52/53 weeks are those in the next year, e.g., Week 54 is the first week in 2004 of the 2003–04 season, as 2003 had 53 weeks, and it is the second week in the rest of the seasons; the grey vertical line indicates the peak week most frequently observed among the 115 cities. (B) Accuracy for each predicted lead time with respect to the week of forecast; negative values represent time in the past, e.g., −1 is a peak predicted 1 week in the past. The week 0 predictions are omitted.

