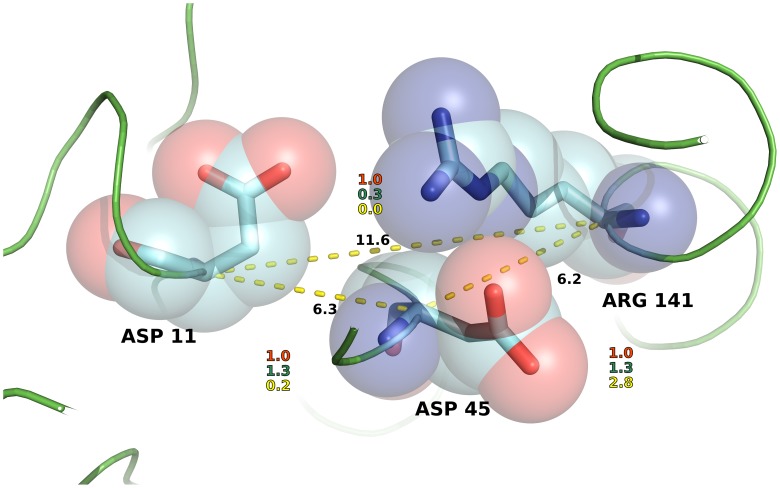
Figure 12. Illustration of the representation of inter-residue interactions by the different NMA methods.
The figure shows three amino acids (D11, D45 and R141) from the M. tuberculosis ribose-5-phospate isomerase (PDB ID = 2VVO). The distances between alpha carbons are shown with the yellow dotted lines and labeled in black. Interaction strengths relative to ANM (in red) are shown for STeM (green) and ENCoM (yellow). ANM treats all pairs as equal while STeM treat equally D11 and R141 with respect to D45 even though the interaction between D45 and R141 is much stronger by virtue of side-chain interactions, as correctly described in ENCoM.

