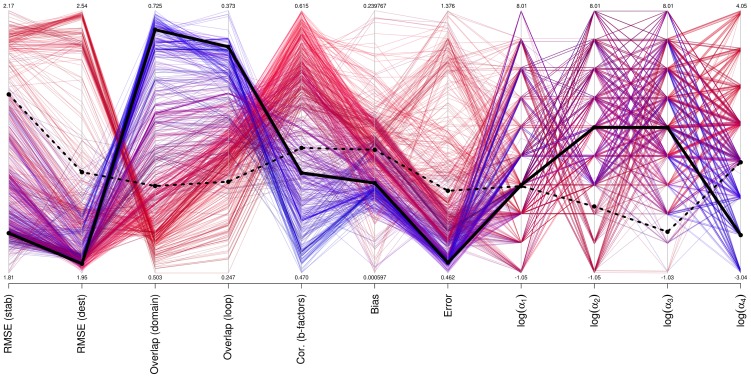
Figure 13. Performance of different parameter sets on the prediction of mutations, b-factors and motions.
We present as a parallel plot the bootstrapped median RMSE for stabilizing and destabilizing mutation, average best overlap for domains and loop movements as well as self-consistency bias and errors. In the right-most four columns with include the logarithm of the 4 alpha variables. Different parameter sets are colored based on b-factors correlations (red gradient) or domain movement overlaps (blue gradient). The black line represent the specific set of parameters used in ENCoM while the dashed line represents the values for ENCoM using the set of alpha parameters employed in STeM. There is a dichotomy in parameter space such that most sets of parameters are either good at predicting b-factors or overlap and mutations.

