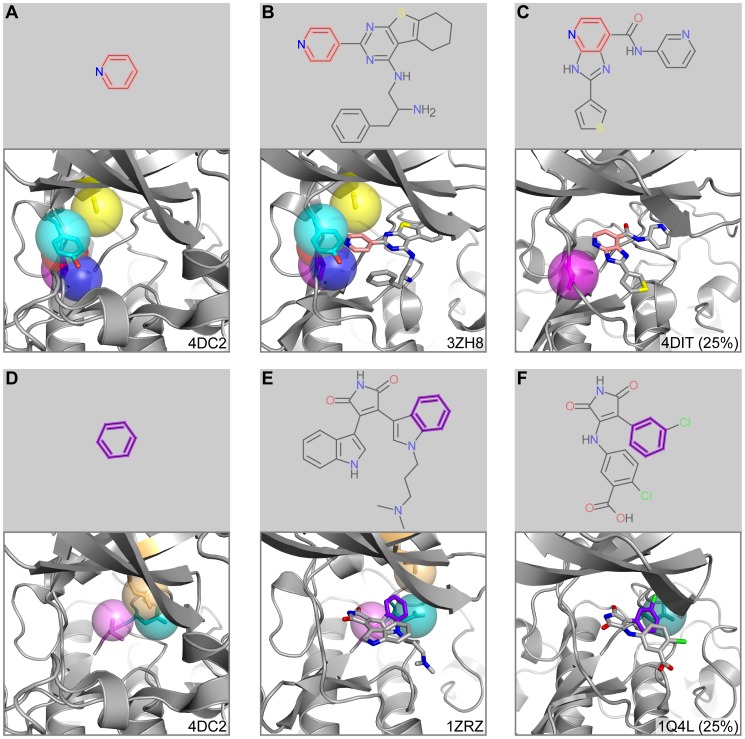
Figure 6. Fragment prediction and validation for aPKC.
A) Fragment 1049 and the microenvironments from the query aPKC structure associated with the fragment prediction. B) PDB ligand C58 and an alternate structure of aPKC bound to C58. Fragment 1049 substructure of C58 is in pink. C) Example nearest neighbor microenvironment from GSK3β. Fragment 1049 of the bound PDB ligand 0KD is in pink. The percent sequence identity between GSK3β and aPKC is in parentheses. D) Fragment 241 and the microenvironments from the query aPKC structure associated with the fragment prediction. E) PDB ligand BI1 and an alternate structure of aPKC bound to BI1. Fragment 241 substructure of BI1 is in purple. F) Example nearest neighbor microenvironment from GSK3β. Fragment 241 of the bound PDB ligand 679 is in purple. The percent sequence identity between GSK3β and aPKC is in parentheses. Proteins are shown in cartoon representation with microenvironments as semi-transparent spheres. Microenvironment color scheme is arbitrary but consistent between panels. Side chains corresponding to microenvironments are shown in stick representation. Ligands are also drawn in stick representation.

