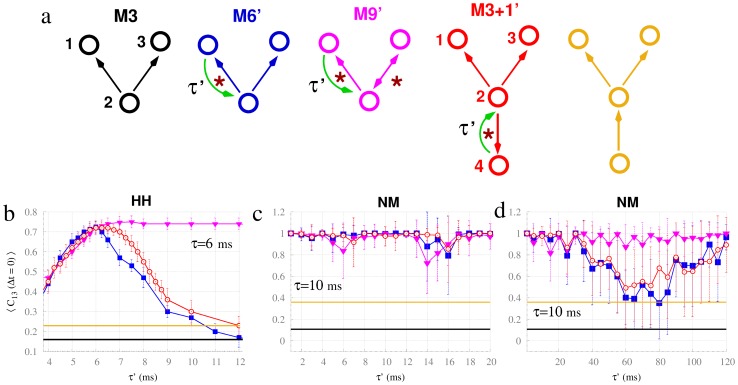
Figure 6. Robustness of the synchronization with respect to mismatch in the delays.
The top schemes (a) illustrate the motifs of neurons considered. Motifs M6′, M9′ and M3+1′ have one connection with delay  , and all the other connections have delays of 6 ms. The bottom panels show the zero-lag crosscorrelation between nodes 1 and 3 in motifs of Hodgkin-Huxley neurons (b) and in motifs of neural mass models with c = 0.01 (c) averaged over 40 trials for varying
  . Panel (d) shows the same as (c) but across a broader range of
  . Plot colors correspond to motifs as per panel a.

