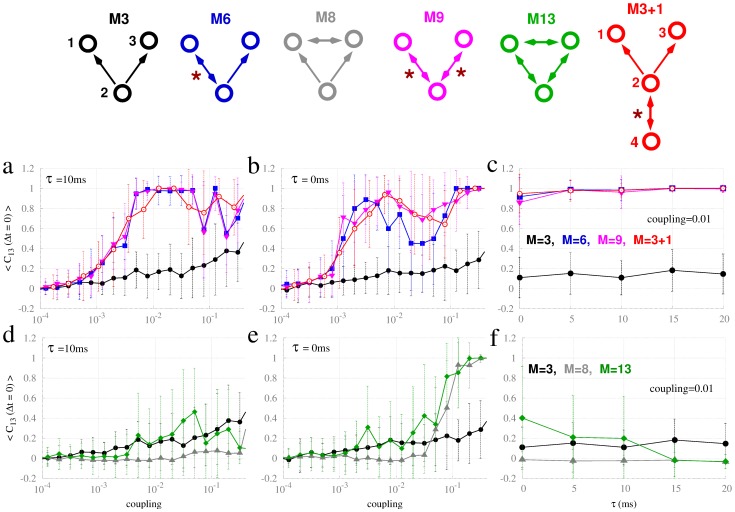
Figure 7. Zero-lag crosscorrelation between neural masses 1 and 3 for different common-driving motifs.
Top: Common-driving motifs, labeled as per Sporns and Kötter (2004) [9], see Fig. c1 a. Bidirectional connections (red stars) indicate active resonance pairs. Top row panels compare common driving (M3) to common driving with resonance pairs (M6, M9 and M3+1) for varying coupling (panels a and b) and varying delay (panel c). Bottom row panels compare common driving (M3) to a ring of mutually coupled nodes (M13), and to common driving plus a bidirectional connection between 1 and 3 (M8) as a function of coupling (panels d and e) and time delay (panel f). Curve colors correspond to the motifs depicted on the top of the figure.

