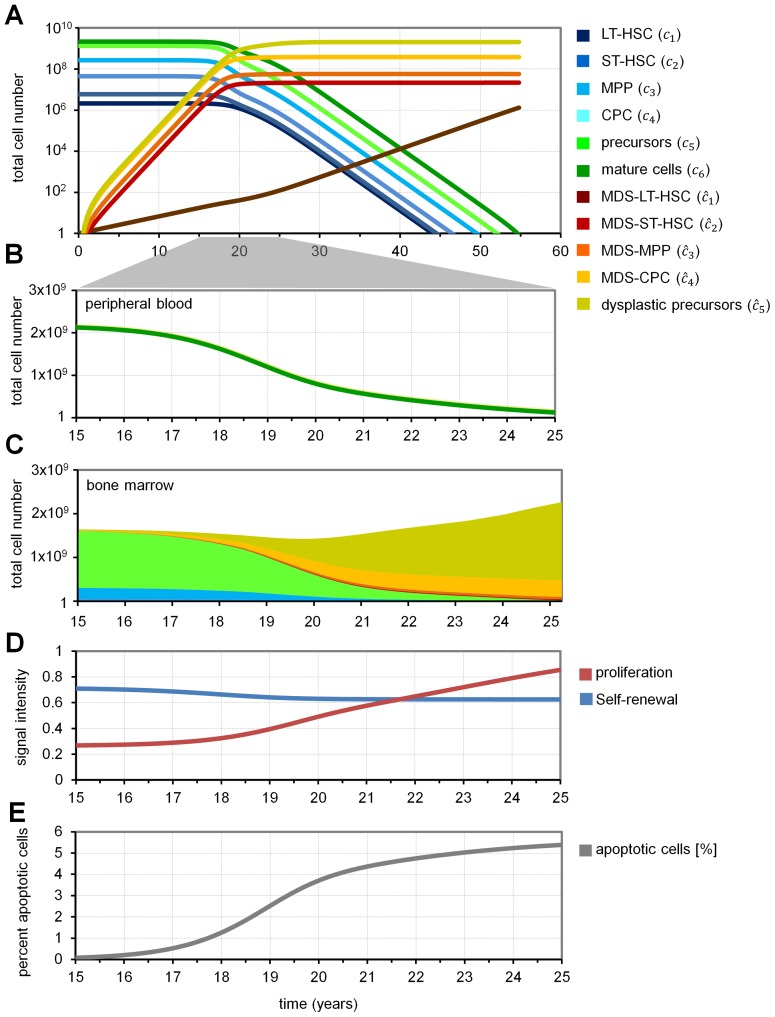
Figure 2. Simulation of MDS development.
(A) Simulated MDS development under the assumptions depicted in Figure 1. Initially, a single MDS-LT-HSC is present. Evolution of cell numbers in the different compartments is simulated over 55 years. (B) A sharp decline of mature cells is achieved after about 17 years – this would correspond to clinical manifestation of MDS. (C) Simulated cellular composition in the BM at the relevant time frame. (D) Corresponding signal intensities for self-renewal and proliferation are presented. Self-renewal decays due to the accumulation of malignant cells in the BM-niche; proliferation is activated due to ineffective hematopoiesis. (E) The percentage of apoptotic cells in the bone marrow is presented.

