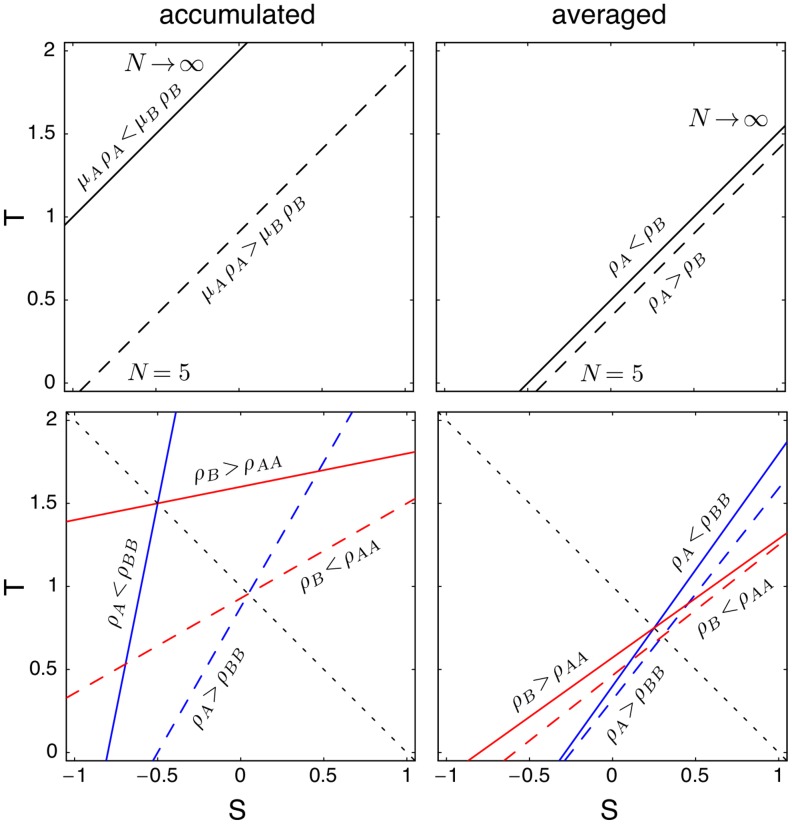
Figure 5. Criteria for evolutionary success on the star graph for accumulated (left column) and averaged (right column) payoffs for weak selection,  .
.
The range for which  is advantageous (top row, c.f. Eq. (15)) depends on the population size,
  , and is shown in the limit
  (solid line) and for
  (dashed line). Below the respective lines
  is favoured. Similarly, the range for which
  and
and  mutants are beneficial (c.f. Eq. (16) also depends on
  .
.  mutants are beneficial above the red lines, while
  mutants are beneficial below the blue lines (solid for
  ; dashed for
  ). Additive games (or equal-gains-from-switching) satisfy
  (dotted line).

