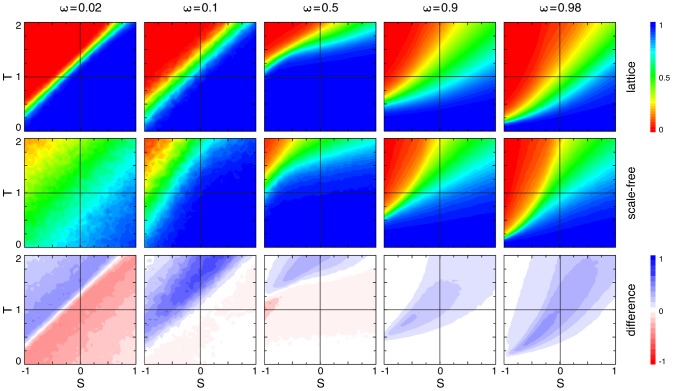
Figure 6. Average fraction of strategy  for different ratios between interactions and strategy updates in homogenous (top row) and heterogeneous (middle row) populations and the difference between them (bottom row) as a function of the game parameters
  and
and  (c.f. Figure 3).
Interactions occur with probability  and strategy updates with
  . For example, for
  each individual has, on average, initiated
  interactions between strategy updates but only an average of
  interactions for
  . For small
  effects of heterogenous population structures have little chance to manifest themselves and the results are closer to those for averaged payoffs (c.f. Figure 3). In contrast, for large
  heterogeneity plays an important role: for scale-free networks it is guided by the structural heterogeneity whereas in homogenous populations another form of heterogeneity spontaneously emerges in the number of interactions. Even on lattices, stochastic differences in the number of interactions get amplified by the dynamics because an increased number of interactions reduces the chances that an individual updates its strategy (c.f. Figure 7). As a consequence the results for lattices and scale-free networks become increasingly similar but scale-free networks keep promoting
  types to a greater extend. Parameters and averaging technique are as in the caption to Figure 3.

