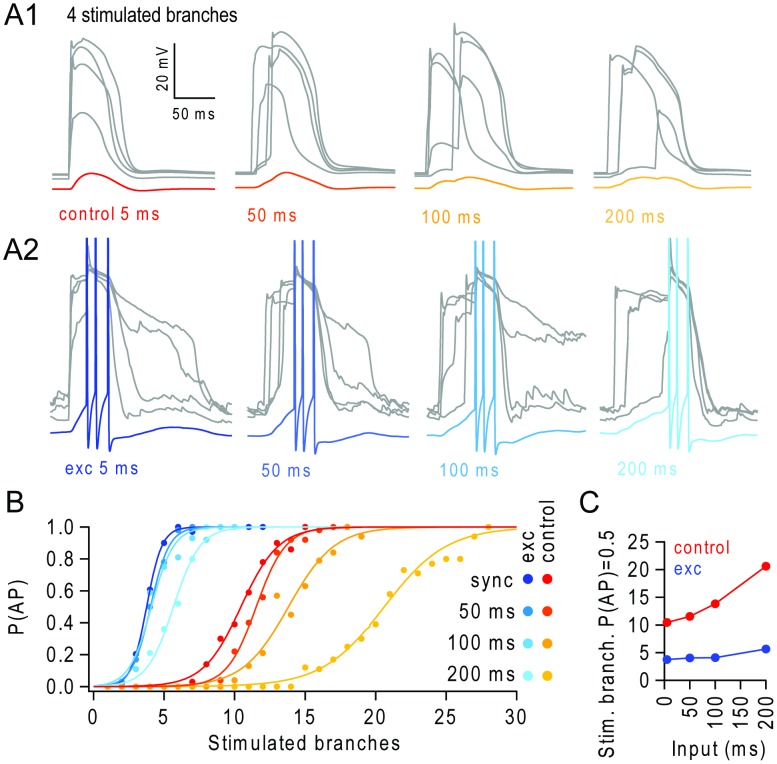
Figure 3. Background excitatory input extends the temporal integration of stimulated branches.
(A1) Left panel: example voltage traces in 4 terminal apical branches during near synchronous branch activation (5 ms window, 30 synapses per branch; grey traces) and from the soma (red). Other panels show responses when stimulated branches are desynchronized in progressively larger temporal windows (50 ms, 100 ms, 200 ms; soma traces lighter shades of orange). (A2) Same as A1 but during background input from 1500 excitatory synapses, for near-synchronous branch stimulation (5 ms; dark blue) or desynchronized in progressively larger temporal windows (50 ms, 100 ms, 200 ms; soma traces lighter shades of blue). (B) Probability of action potentials (P(AP)) versus number of stimulated apical branches for different degrees of temporal dispersion during background activity from 1500 background excitatory synapses (blue lines) compared to control condition (red-yellow lines). (C) Number of stimulated branches required to trigger an AP with 50% probability (P(AP) = 0.5), for different levels of temporal dispersion in the stimulated branches (input window), in the absence (red) and presence of background excitatory input (blue).

