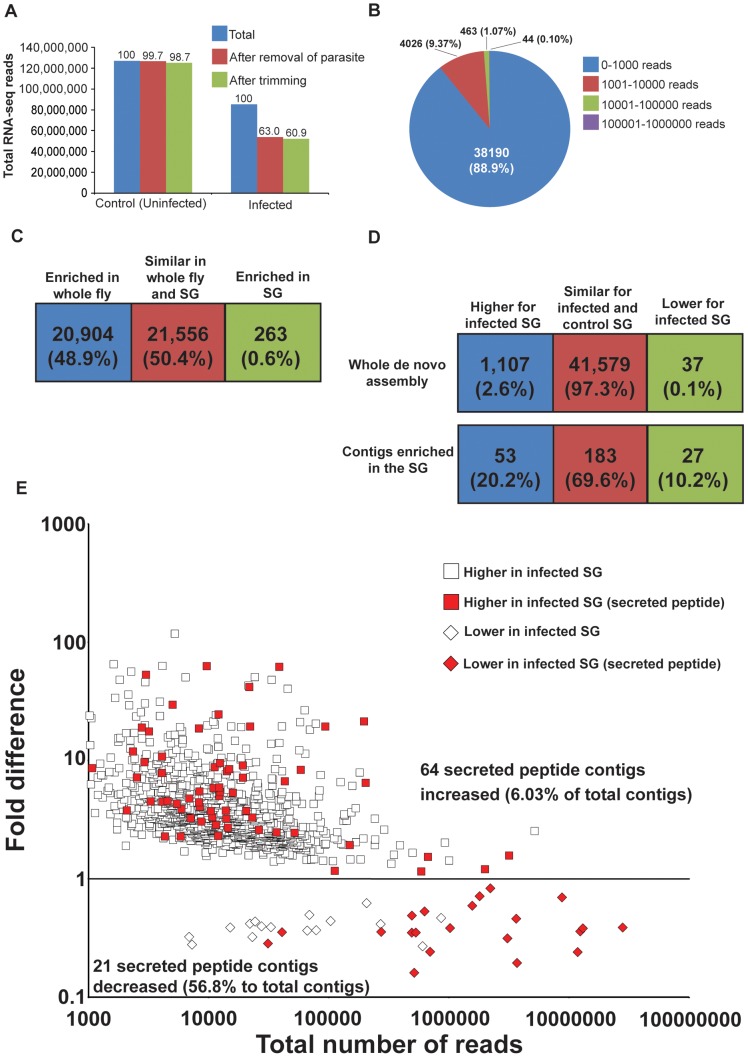
Figure 1. Overview of salivary gland transcriptome analysis.
A. Number of RNA-seq reads after quality control and removal of parasite reads. B. Reads per contigs for control salivary gland. C. Contigs enriched in salivary glands (SG-enriched data set) in relation to whole female fly transcriptome data. D. Contigs with higher or lower expression following parasite infection in the salivary glands. E. The abundance of reads and fold difference of expression per contig are shown from parasite infected (shown in red) and from normal (shown in white) salivary glands. Those denoted below the line indicate reduced expression while those above indicate increased expression. The red dots below the line indicate the 21 secreted peptide contigs that correspond to 56.8% of total contigs.

