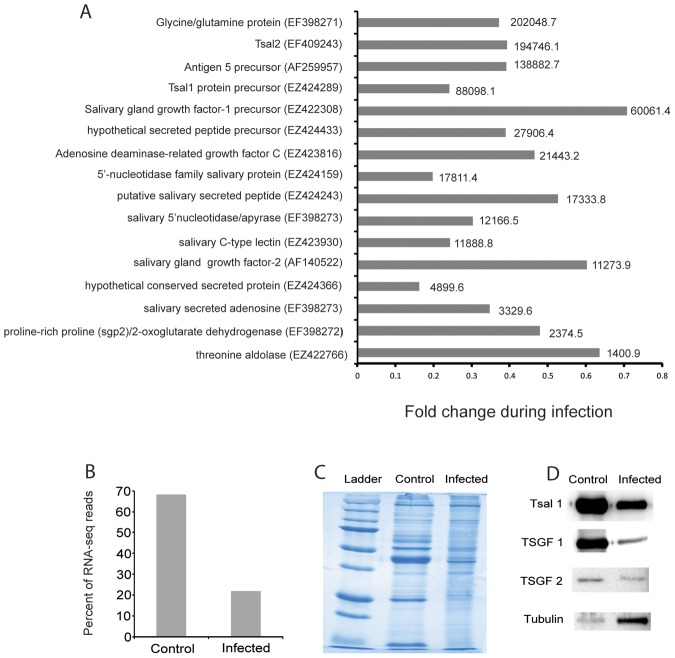
Figure 4. Specific salivary gland contigs and proteins suppressed during trypanosome infection.
A. Fold change during salivary gland infection based on RNA-seq analysis from SG-enriched dataset that have a combined infected and control RPKM value of over 1000 from Table S1. The combined infected and control RPKM value is shown next to each bar. B. Percent of RNA-seq reads represented by the contigs with decreased expression during trypanosome infection. C. Total protein profile analyzed by SDS-PAGE analysis from one pair of infected and control salivary glands, one representative sample is shown. D. Western blot analysis of Tsal1, TSGF-1, TSGF-2 as well as Tubulin from control and infected SG.

