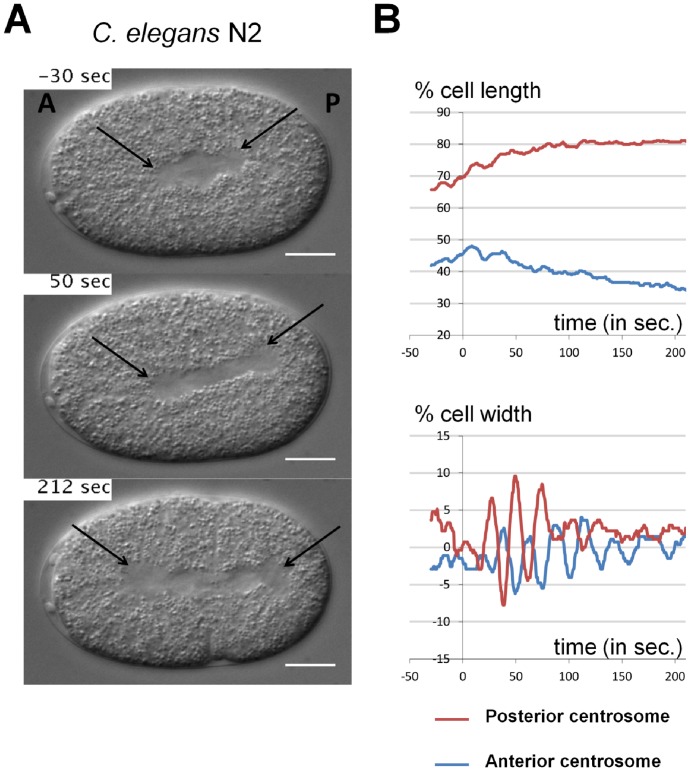
Figure 1. Centrosome displacements from manual tracking.
A. Snapshots from DIC recording of C. elegans N2 wild-type one-cell stage embryo. Anterior is to the left and posterior to the right. Centrosomes are shown with black arrows. Scale bar is 10 µm. B. Manual tracking of centrosomes displacement on the transverse (upper panel) and antero-posterior (lower panel) axes over time relative to anaphase onset (t = 0 sec defined as the initial separation of chromosomes observed by DIC microscopy), for the embryos showed in A. The positions of the posterior and anterior centrosomes are represented by the red and the blue curves, respectively. For the antero-posterior displacement 0% corresponds to the anterior pole, 100% to the posterior pole of the cell. For the transverse displacement 0% is the center of the cell, 50% the upper side of the cell and −50% is the lower part of the cell.

