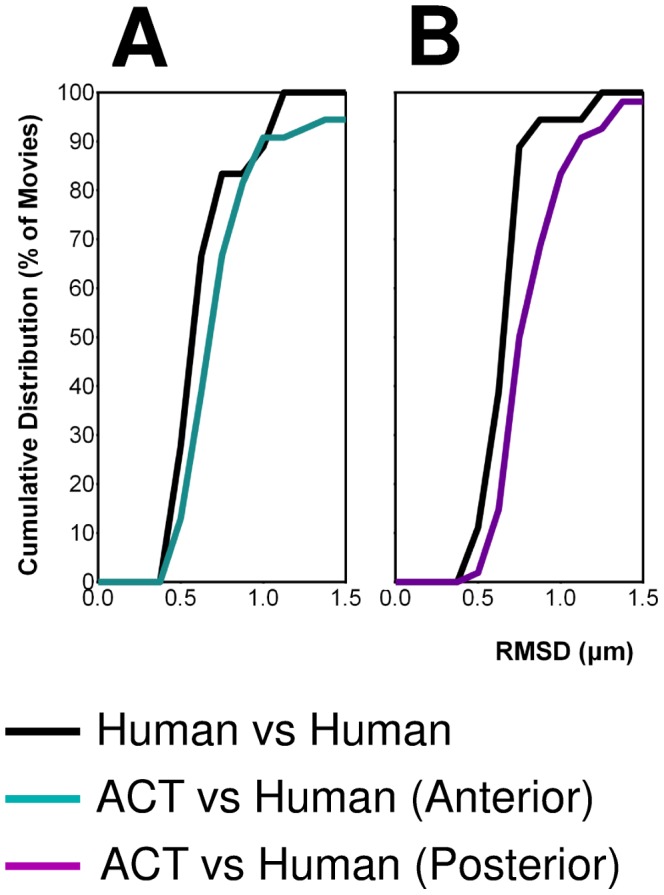
Figure 3. Accuracy of centrosome tracking.

Normalized cumulative distributions of RMSD values for the tracked trajectories of the anterior centrosome in A. and posterior centrosome in B. The curves “Human vs Human” and “ACT vs Human” are composed of 16 and 54 movies, respectively (Table S1). The curves were constructed with a bin size of 0.1 µm.
