
Figure 2.
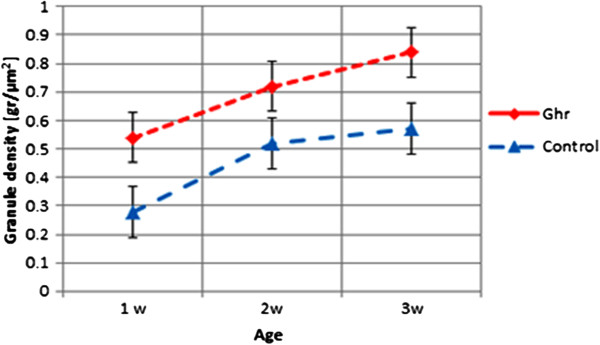
Quantified synaptophysin expression during culture development. Synaptophysin is quantified from images as in Figure 1 at different ages under control (ctrl) conditions and after chronic treatment with ghrelin (ghr). Expression was significantly higher in ghrelin treated cultures than in control (p < 0.001). Error bars indicate SEM.