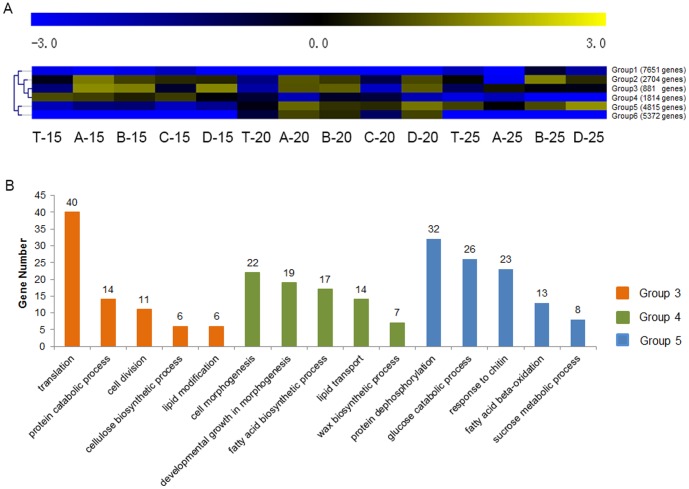
Figure 1. Statistical analysis of transcriptome data.
(A) SOTA clustering of the different genes using Log2(TPM). T, TM-1; A, CSIL-35431; B, CSIL-31010; C, CSIL-31134; D, CSIL-35368. 15, 15 DPA; 20, 20 DPA; 25, 25 DPA. (B) Distribution of functions of genes in different clusters. Yellow square indicated group 3, green square indicated group 4 and blue square indicated group 5. X-axis indicated different enriched process and Y-axis indicated number of hit-found genes in these processes.

