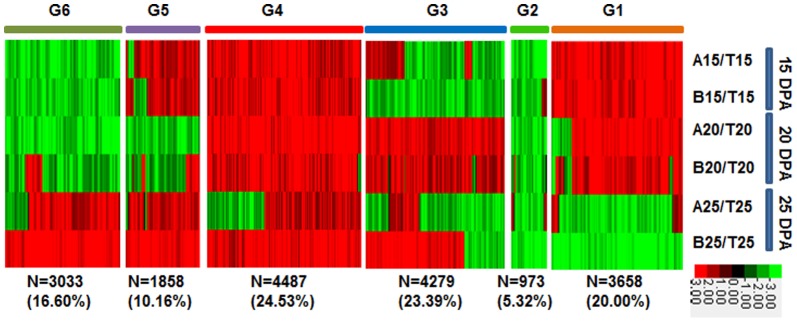
Figure 4. Heat map analysis of the expression of DEGs between CSILs and TM-1.

A, B and T indicated CSIL-35431, CSIL-31010 and TM-1, respectively. 15, 15DPA; 20, 20DPA; 25, 25DPA. Red color indicated up-regulated genes and green color indicated down-regulated genes. N = number of DEGs in different group.
