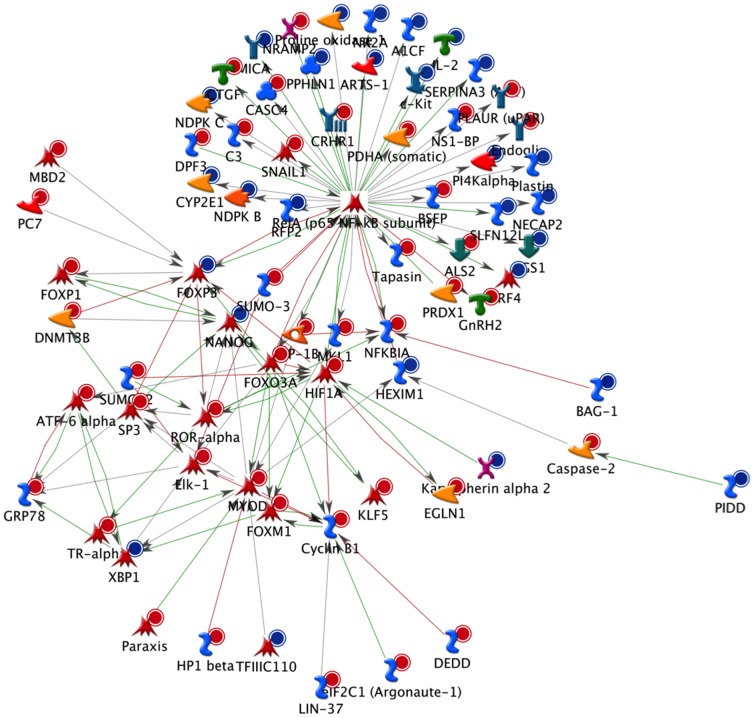
Figure 3. An NF-κB biological network based on the differentially expressed genes in circulatory cells obtained from MetaCoreTM network software and the “Analyze” network algorithms.
Dots in the right corner of a gene indicate differential expression, blue for down-regulated genes and red for up-regulated genes.

