
Figure 7. Intra-individual DNA methylation before and after MOF supplementation.
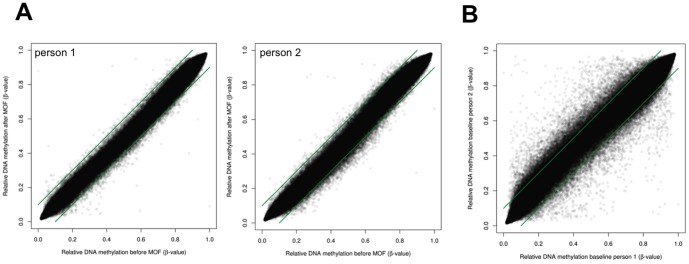
Genome wide DNA methylation profiles of blood leukocyte gDNA of 10 individuals were profiled by Illumina 450K CpG array. A) DNA methylation intensities (β-values 0<x<1, reflecting 0–100% DNA methylation) of 450,000 CpG probes were plotted as dots along the X and Y axis to compare DNA methylation variation before and after 8 weeks MOF supplementation in 2 representative subjects. B) DNA methylation intensities (β-values 0<x<1, reflecting 0–100% DNA methylation) of 450,000 CpG probes were plotted as dots along the X and Y axis to compare DNA methylation variation at baseline between 2 representative subjects. Green lines represent cut-off values of 10% difference in β-values.