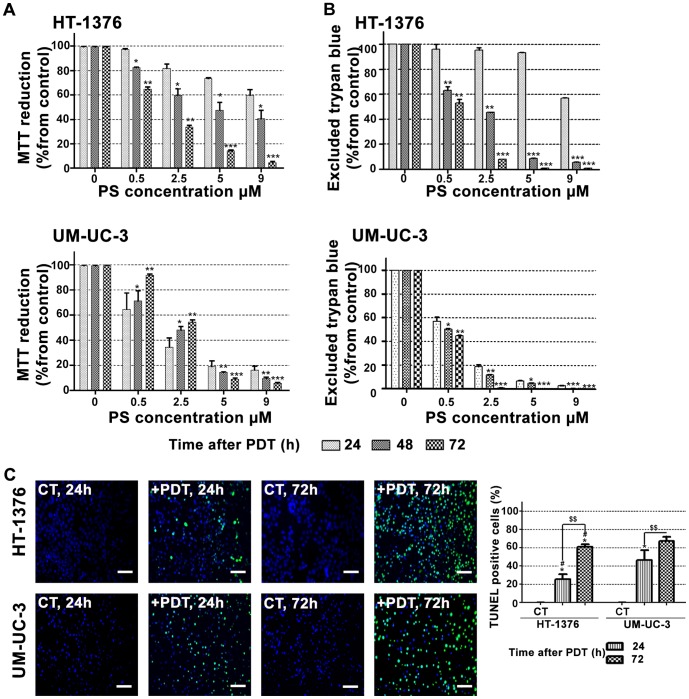
Figure 3. PDT with PcGal16 has a long-term phototoxicity effect.
Cytotoxicity was assessed 24, 48, and 7216-PDT using the MTT (panel A) and trypan blue staining (panel B) assays. The percentage of cytotoxicity was calculated relatively to control cells (cells incubated with PBS in darkness and then irradiated) at the respective uptake time. Data are the mean value ± S.D. of at least three independent experiments performed in triplicates. *(p<0.05), **(p<0.001), ***(p<0.0001) significantly different from MTT reduction (%) or excluded trypan blue (%) at 24 h after PDT for the respective concentration. Representative fluorescence images revealing cell death in HT-1376 and UM-UC-3 cells after PDT with PcGal16 by TUNEL staining 24 and 72 h after treatment (panel C). DAPI was used for nuclei staining (blue) and TUNEL staining was used to visualize dead cells (green). Scale bars 20 µm. Quantification of TUNEL-positive cells 24 and 72 h after PDT with PcGal16. *(p<0.05) significantly. different from control cells. $$(p<0.001) significantly different from TUNEL-positive cells 24 h after PDT. #(p<0.05) significantly different from TUNEL-positive UM-UC-3 cells at the respective time after PDT.

