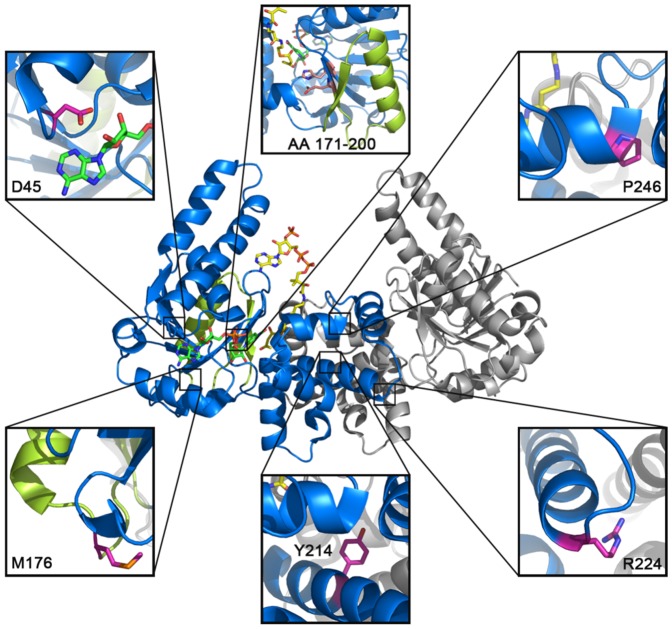
Figure 1. Mapping disease related mutations into human HAD crystal structure (PDB entry 1F0Y).
Two monomers of HAD are colored in blue and grey, respectively. The carbon atoms of NAD+, acetoacetyl-CoA (AACoA), side chains of mutated residues and catalytic His-Glu pair of one monomer (blue) are colored in green, yellow, magentas and salmon, respectively. Regions colored in lemon refer to the in-frame deletion from 171–200 (c.547-3_549 deletion in HAD gene). If not mentioned, all the structure illustrations were generated with PyMOL (http://www.pymol.org. Accessed 2014 March 26th.).

