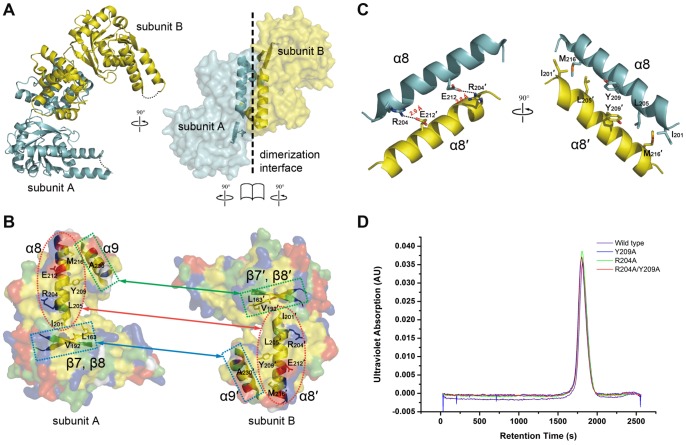
Figure 3. Dimerization interface of cHAD.
(A) Ribbon (left) and surface (right) diagram of the crystal structure of cHAD dimer in an asymmetric unit. The two molecules, subunit A and subunit B, colored in cyan and yellow respectively in the ribbon diagram, are arranged in a “tail-to-tail” manner through interactions between their C-terminal domains. The loop between helix α2 and α3 with weak electron density is indicated by dotted line. In the surface diagram, only secondary structures involving dimerization are depicted. (B) An “open-book” view of the dimerization interface between subunit A and B. The negatively charged, positively charged, polar, hydrophobic and glycine residues on the surface are represented in red, blue, green, yellow and white, respectively. The contact sites of the dimerization interface via α8/α8′, α9/β7′–β8′ and α9′/β7–β8 are indicated by the red dotted ellipse, green dotted rectangle and blue dotted rectangle. (C) Core dimerization interface. A combined ribbon and stick model illustrates both electrostatic (left) and hydrophobic (right) interactions between each α8 helix of two subunits. Salt bridges are indicated with the dashed lines. (D) Gel filtration profile of the wild type and mutated cHADs. Equal amount of protein (100 µg) was injected onto a pre-equilibrated Superdex 200 column (10/300 GL; GE healthcare) and eluted at a flow rate of 0.5 ml/min.

