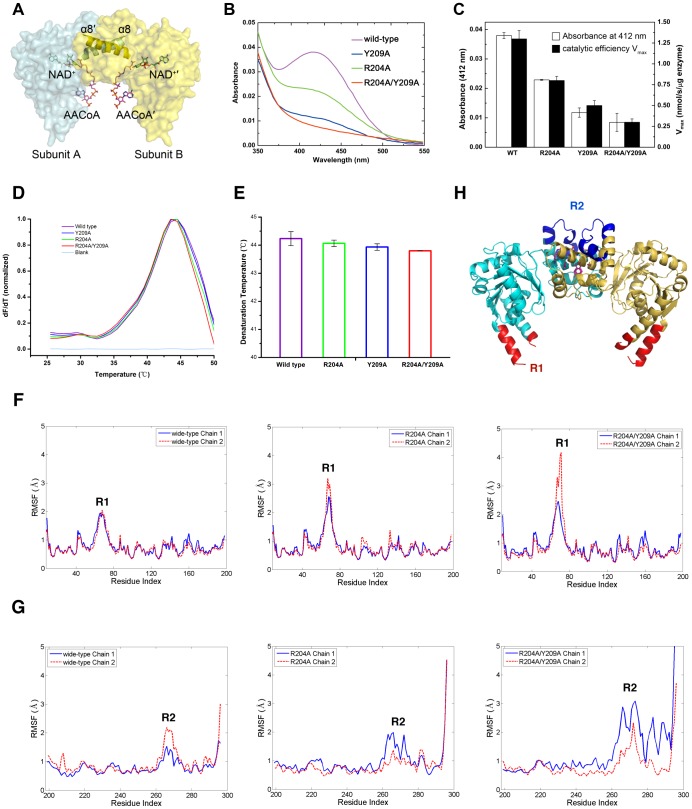
Figure 5. Characterization of the charge transfer complex intermediate formation.
(A) A combined surface and stick model presents a structural model of cHAD ternary complex with the NAD+ and AACoA bound. The α8 helices of the dimer are depicted as ribbons. The positions of NAD+ and AACoA are determined by superposition of the structure of human HAD·NAD·AACoA complex (PDB entry 1F0Y) with the present cHAD crystal structure. (B) Difference absorption spectra of the cHAD·NAD+·AACoA complexes for the wild type (purple), R204A mutant (green), Y209A mutant (blue) and R204A/Y209A mutant (red) at a ligand concentration of 2 mM as described in MATERIALS AND METHODS . (C) Effects of mutations on charge transfer complex formation. The columns filled in white represent the net absorbance of ternary complex formed by cHAD and its variants at 412 nm (scaled by left vertical axis), while the columns filled in black represent their Vmax values determined in kinetic experiments (scaled by right vertical axis). (D) Thermo shift assay of cHAD and its variants. (E) The critical melting temperature (T m) of cHAD and its variants from the thermo shift assay in (D). (F) The root-mean-square fluctuations (RMSF) of cHAD (wild type at left, R204A at middle and R204A/Y209A at right) N-terminal domain residues (1–198) for each subunit (chain 1 and 2). The significant fluctuation regions (R1, a.a. 60–80) are label accordingly. (G) The RMSFs of cHAD (wild type at left, R204A at middle and R204A/Y209A at right) C-terminal domain residues (199–297) for each subunit (chain 1 and 2). The significant fluctuation regions (R2, a.a. 260–280) are label accordingly. (H) Cartoon representation of the crystal structure of cHAD with one subunit colored in cyan and another in gold. The significant fluctuation regions R1 (a.a. 60–80) and R2 (a.a. 260–280) observed in molecular dynamics simulation (F and G) are colored in red and blue, respectively.

