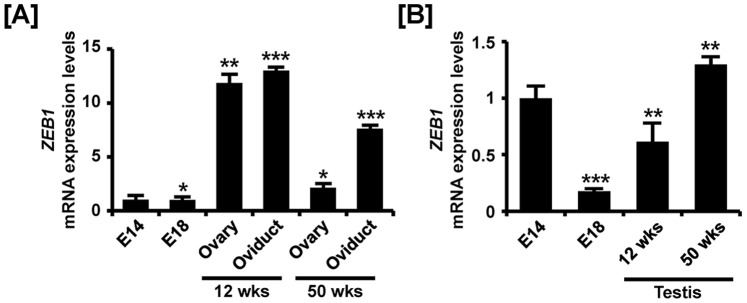
Figure 10. Quantitative analysis of ZEB1 mRNA expression in female and male reproductive tracts during their development.

Quantitative RT-PCR was conducted using cDNA templates from female (A) and male (B) gonads at embryonic days 14 and 18, 12-week-old ovary and oviduct and 50-week-old ovary and oviduct. The asterisks denote statistically significant differences (*** p<0.001, ** p<0.01 and * p<0.05).
