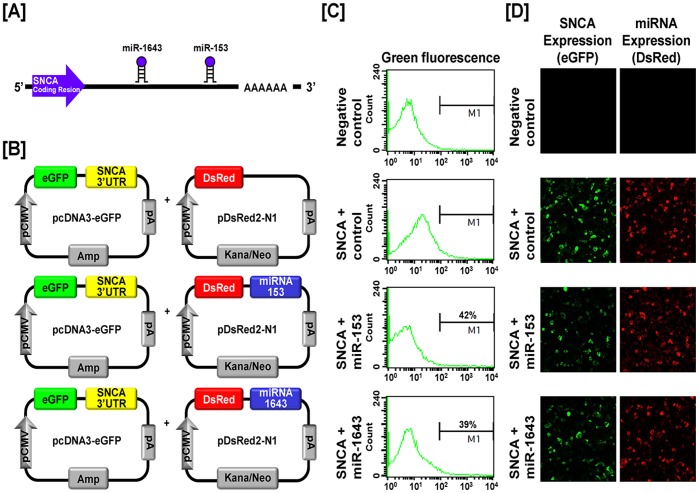
Figure 13. In vitro target assay for miR-153 and miR-1643 on the SNCA transcript.
(A) Diagram showing miR-153 and miR-1643 binding sites in SNCA 3′-UTR. (B) Schematic expression of vector maps for eGFP with SNCA 3′-UTR and DsRed with each miRNA. (C and D) The fluorescence signals of GFP and DsRed were detected using FACS (C) and fluorescent microscopy (D) after co-transfection of pcDNA-eGFP-3′-UTR for the SNCA transcript and pcDNA-DsRed-miRNA for the miR-153 and miR-1643.

