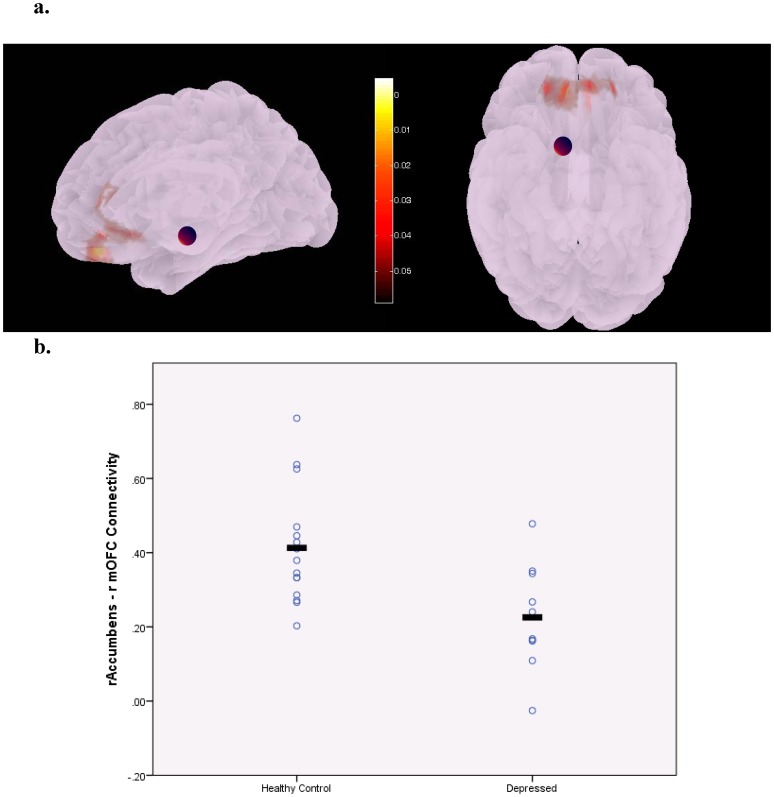
Figure 2. Illustration of areas in the medial orbitofrontal cortex with decreased connectivity with the right accumbens area (indicated by the purple sphere) in unmedicated patients with late-life depression.
The colorbar indicates p-values (<.05) (a). Scatterplot displaying group differences in individual functional connectivity values represented by z-scores (FDR corrected p = .035) (b).

