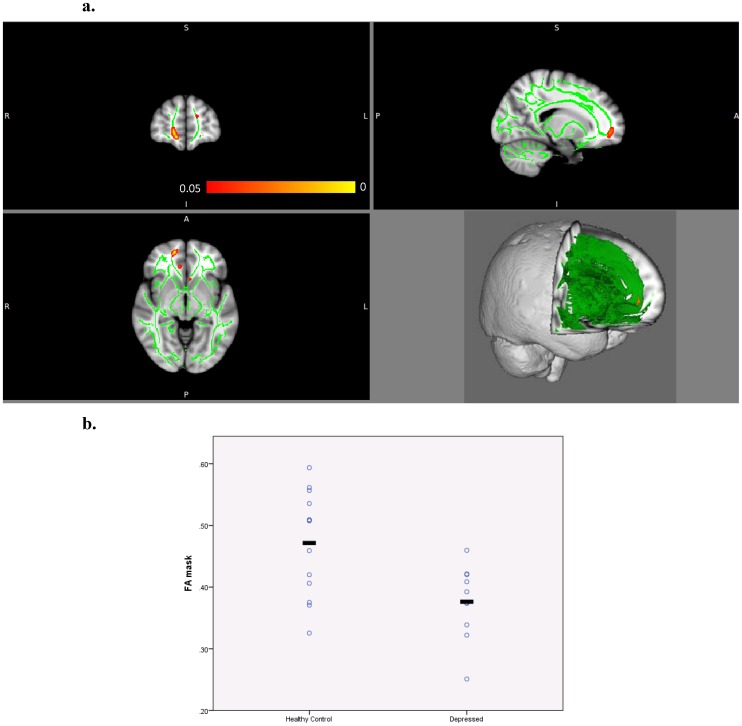
Figure 3. Reduced FA in the right forceps minor (in red-orange) in unmedicated depressed elderly compared to healthy comparison subjects.
The mean FA skeleton is shown in green superimposed onto the standard MN152 brain temple (upper left: coronal view, upper right: sagittal, lower left: axial, lower right: 3D view). The colorbar indicates p-values (<.05) (a). Scatterplot displaying group differences in individual FA values for the masked region in the right forceps minor (uncorrected p<0.0005) (b).

