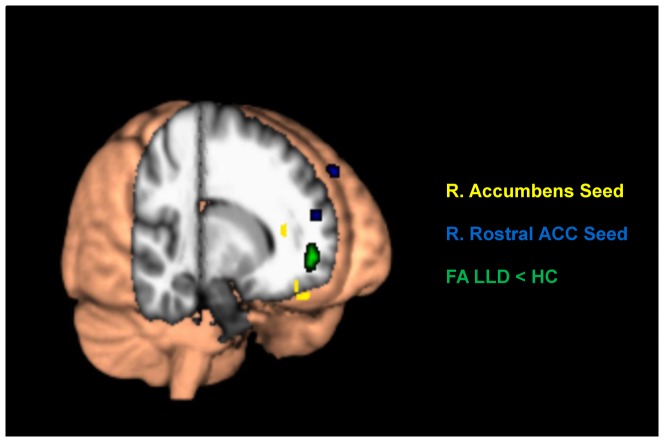
Figure 4. Functional connectivity (FC) and fractional anisotropy (FA) differences indicated on a 3D view of the brain.
Regions in yellow represent areas of decreased FC with the right accumbens area, regions in blue indicate areas of decreased FC with the right rostral ACC, and reduced white matter FA in LLD is shown in green.

