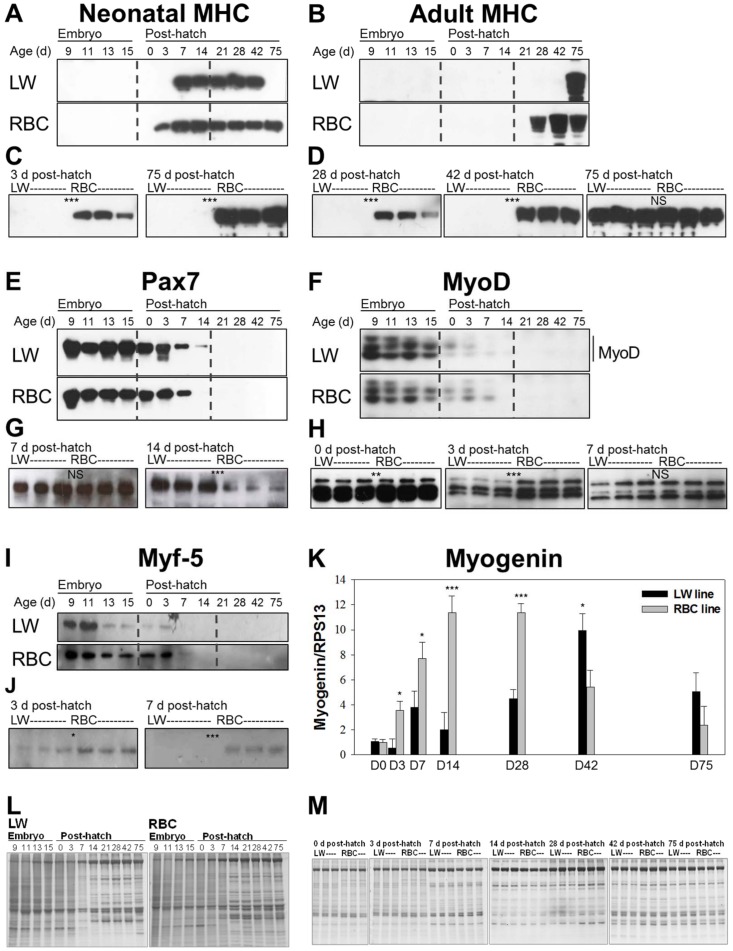
Figure 6. Expression of the different myosin heavy chain (MHC) isoforms and myogenic factors in the low weight (LW) and random bred control (RBC) quail lines.
Time point comparison of the neonatal MHC isoform using 2E9 monoclonal antibody (A), adult MHC isoform using AB8 monoclonal antibody (B), Pax7 (E), MyoD (F), and Myf-5 (I) between the LW and RBC quail lines (1 quail per each time point). Quail line comparison of neonatal MHC isoforms at 3 and 75 d post-hatch (C), adult MHC isoform at 28, 42, and 75 d post-hatch (D), Pax7 at 7 and 14 d post-hatch (G), MyoD at 0, 3, and 7 d post-hatch (H), and Myf-5 at 3 and 7 d post-hatch (J) (3 quail per each time point and each quail line). Expressions of myogenin mRNA in the two quail lines at 0, 3, 7, 14, 28, 42, and 75 d post-hatch (K). Total RNA was isolated from the pectoralis major muscle. Expressions of myogenin were measured by quantitative real-time PCR with avian ribosomal protein 13 (RPS13) as a control for normalization. Protein staining of the different quail lines at each time point (L; 1 quail per each time point) and at 0, 3, 7, 14, 28, 42, and 75 d post-hatch (M; 3 quail per each time point and each quail line). Gels used as a control of protein loading. Bars indicate standard errors. Level of significance: NS, not significant; * P<0.05; ** P<0.01; *** P<0.001.

