
Figure 3.
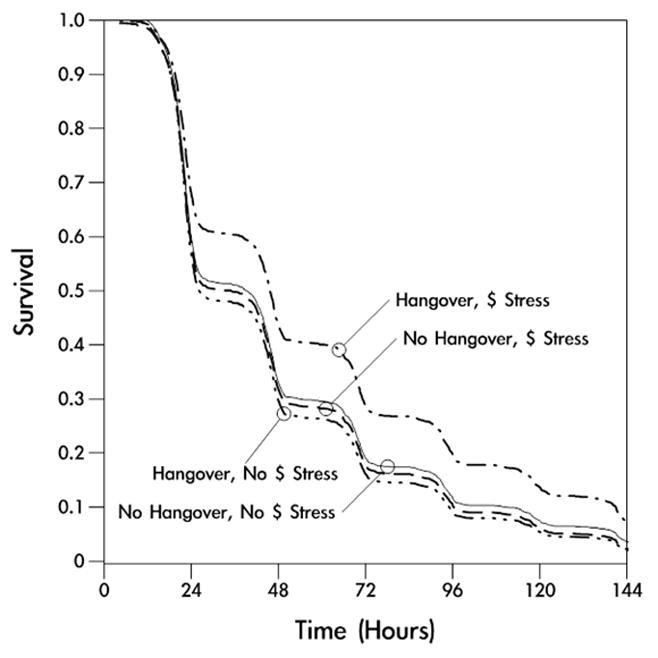
Survival curves at each possible combination of hangover status and endorsement of financial stressor ($ Stress) at the morning report after the index drinking episode. The curves were produced at the mean of all other covariates in the final multivariate model (Table 3).