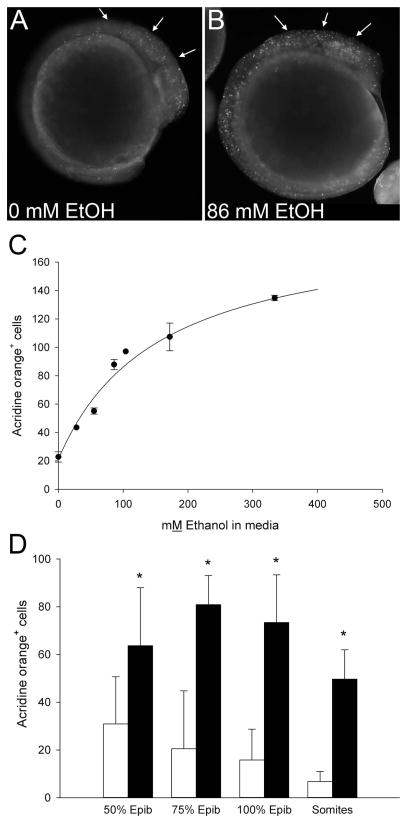
Figure 2. Dose-Dependence and Timing of Ethanol-Induced Cell Death.
(A, B) Cell death, visualized using acridine orange, in representative embryos exposed 3hr at neurulation-stage to (A) 0mM or (B) 86mM ethanolext. Embryos exposed to 86mM ethanolext at 75% epiboly exhibit numerous labeled cells within developing cranial region (arrows), as well as presomitic and postsomitic mesenchyme. (C) Quantitation of dose- dependent cell death in dechorionated embryos (75%–100% epiboly) exposed 3hr to the indicated ethanolext levels (0, 28, 55, 86, 104, 172, 344mM) and assessed 2hr after ethanol removal. . Data are mean ± SEM. (D) Dechorionated embryos were treated with 0mM (open bars) or 86mM ethanolext (solid bars) at the onset of the indicated stages (somites = 3–6 somites) and cell death was quantified as in (C). Values are mean ± SD with 6–20 embryos per group. * Significantly differs from 0mM ethanol at p<0.05, using Kruskal-Wallis one-way ANOVA on ranks and Dunn’s pairwise comparison.

