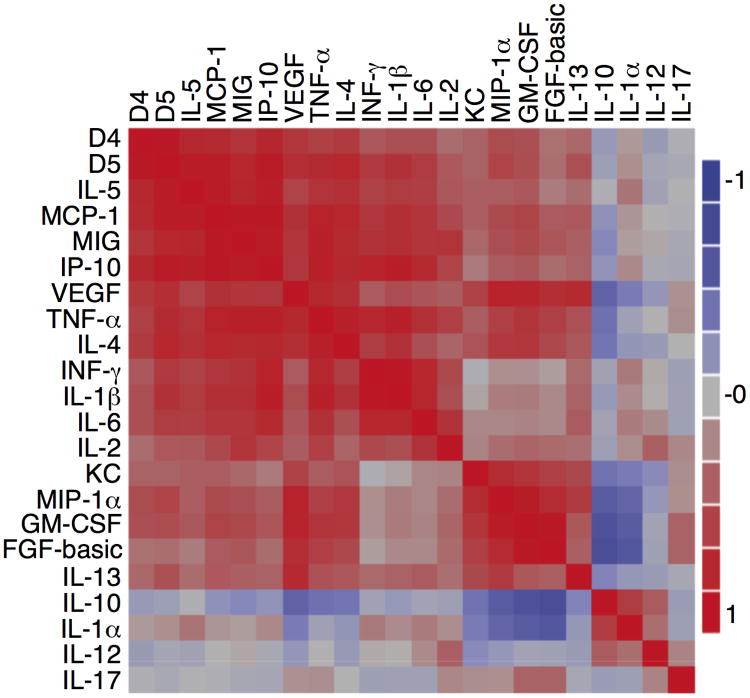
Figure 2.
Correlation of cytokine/chemokine responses among the progeny of the N67×17XNL cross. The color bar indicates degree of correlation, with red indicating positive correlation and blue indicating negative correlation. Correlation analysis was performed using GraphPad Prism version 6.0 (GraphPad Software, Inc.).

