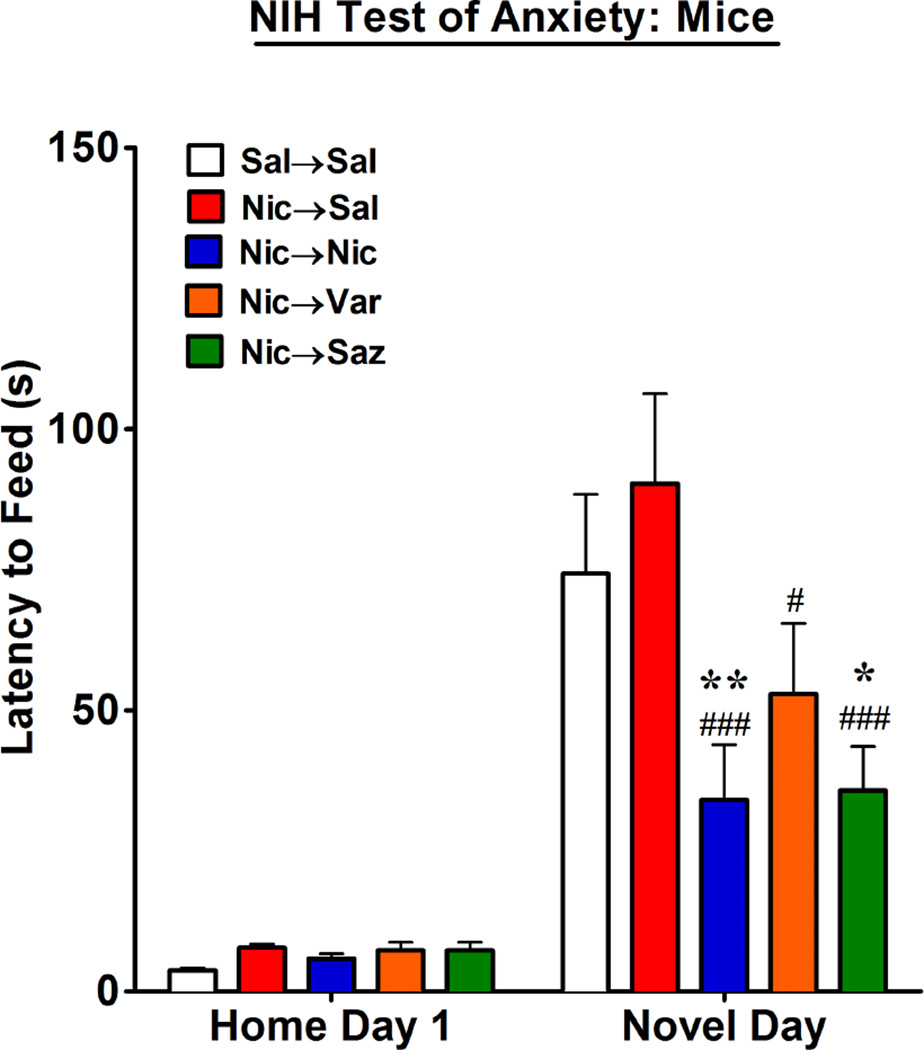
Figure 3. NIH Test of Anxiety.
Male mice were trained for the NIH test of anxiety (see methods) and then underwent the 2-phase drug treatment paradigm as illustrated in figure 1A. On the 6th day of phase 2 treatments, the latency for mice to feed was measured in their home cage. The next day, the latency for mice to feed was measured in a novel environment. The data are expressed as the mean ± SEM from 8 – 16 individual animals per group and statistical analysis was performed by a two-way ANOVA with a post-hoc Bonferroni test (Compared to Sal→Sal: *p<0.05; **p<0.01. Compared to Nic→Sal; #p<0.05; ###p<0.001).

