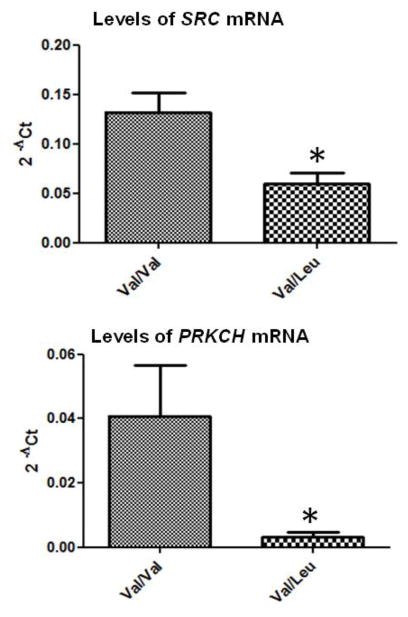
Fig. 2.
Quantitative PCR validation of whole genome data using single gene real time PCR assays. RNA was extracted from the Val/Val (n=6) and Val/Leu (n=5) cells, converted to cDNA, and subjected to qPCR. Relative expression levels are shown with 2−ΔCt values (* represents statistical significance T test p<0.05), SRC (upper panel) and PRKCH (lower panel), with the human large ribosomal protein (RPLPO) as an endogenous control.

