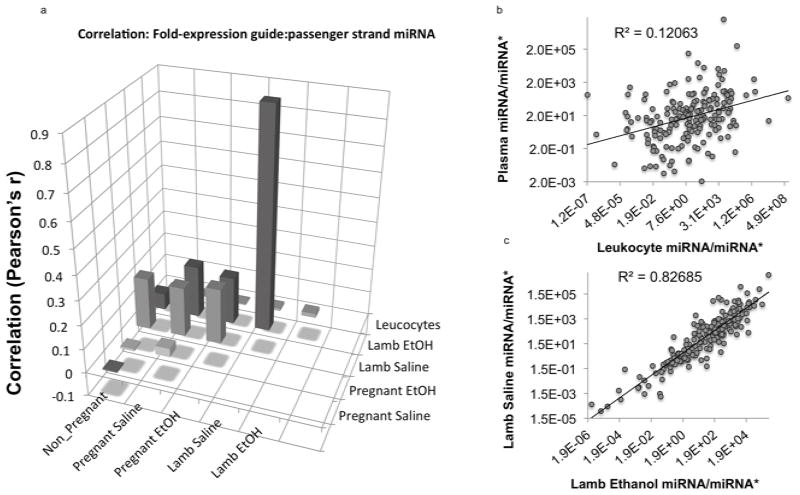
Figure 7.
Analysis of the ratio of guide to passenger strand (miRNA/miRNA*) expression. (a) Bar graph of correlation matrix. ‘Y’ axis indicates Pearson’s ‘r’. Data show that leukocyte miRNA/miRNA* ratios do not correlate with ratios in plasma samples. There was also not a statistically significant correlation between plasma miRNA samples from control and ethanol-exposed pregnant ewes (r=0.036, p<0.63), but a strong correlation between control and in utero ethanol exposed neonatal lamb r=0.9, p<0.0000001). (b,c) miRNA/miRNA* correlations between (b) plasma and leukocytes, and (c) between control and in utero exposed neonatal lambs.

