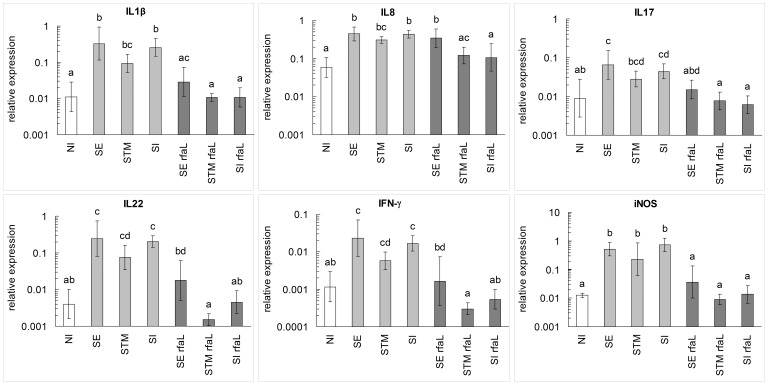
Figure 1. Cytokine gene expression in the cecum of orally infected chickens.
Columns represent geometric means of the relative expressions of respective genes. Vertical bars represent 95% confidence intervals regarding the geometric means. Superscripts above columns denote statistically significant differences among groups (columns sharing the same superscript are not significantly different from each other, columns that have no superscript in common are significantly different from each other). NI, expression in the non-infected chickens. SE, expression in the chickens infected with S. Enteritidis 147. STM, expression in the chickens infected with S. Typhimurium LT2. SI, expression in the chickens infected with S. Infantis 1516. SE rfaL, expression in the chickens infected with S. Enteritidis rfaL mutant. STM rfaL, expression in the chickens infected with S. Typhimurium rfaL mutant. SI rfaL, expression in the chickens infected with S. Infantis rfaL (I) mutant. Mind logarithmic scaling of Y-axis.

