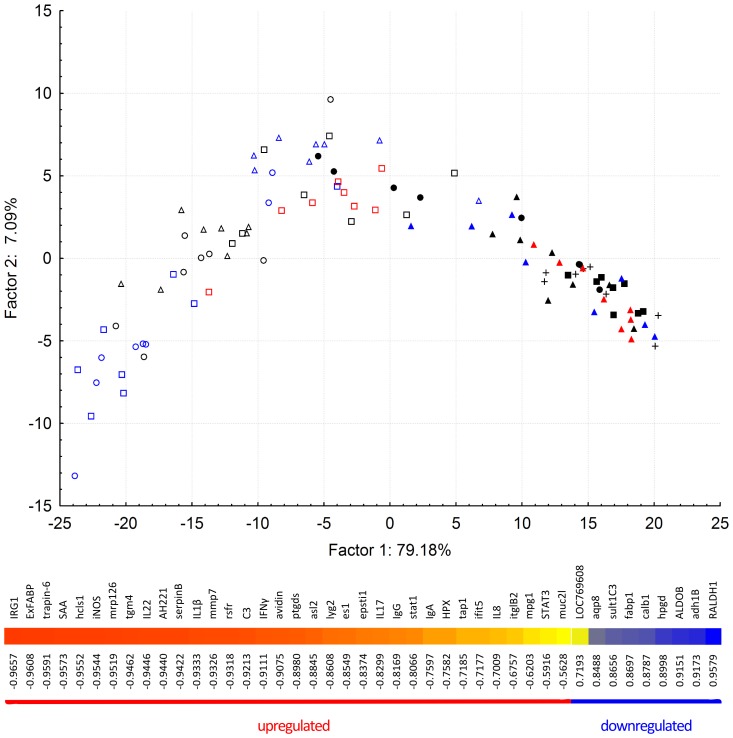
Figure 3. PCA plot of the chickens clustered according to their gene expression in the cecum and heat map correlation coefficients between factor 1 and individual gene expression.
Open black circles, S. Enteritidis 147; Open blue circles, S. Enteritidis G1481; open black squares, S. Typhimurium LT2; open blue squares, S. Typhimurium 2002; open red squares, S. Typhimurium 2454; open black triangles, S. Infantis 1516; open blue triangles, S. Infantis 514; closed black circles, S. Enteritidis 147 rfaL mutant; closed black squares, S. Typhimurium LT2 rfaL mutant; closed black triangles, S. Infantis 1516 rfaL (I) mutant; closed blue triangles, S. Infantis 1516 rfaL (II) mutant; closed red triangles, S. Infantis 1516 rfaL (III) mutant. symbol “plus”, non-infected chickens. PCA also showed that a single factor explained nearly 80% of the variation in the chicken response. This factor was the scope of inflammation itself as high and significant correlations were observed between the expression of individual genes and the positioning of corresponding chickens along X axis. Genes are arranged from the most positively correlated to the most negatively correlated ones.

