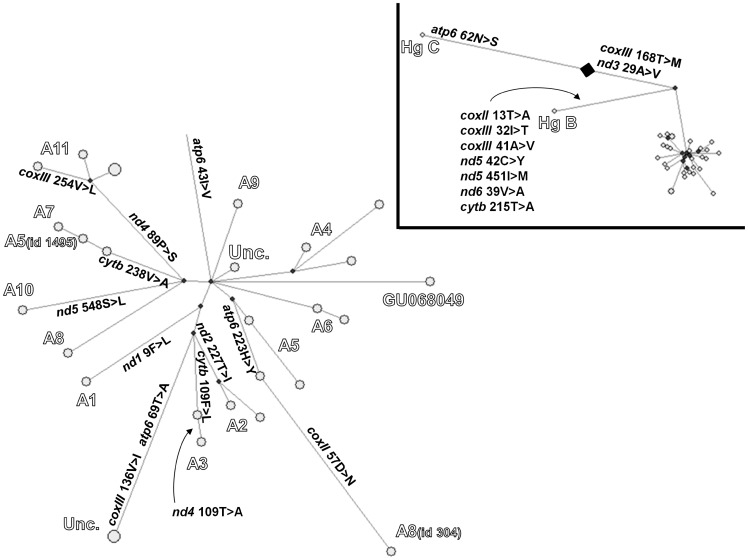
Figure 1. Median joining network of 30 sequences showing the occurrence of 23 non-synonymous substitutions.
Each circle represents a sequence. Branch length is proportional to the number of mutations. Note that two A11 and two uncharacterized sequences are lumped into single (larger) nodes (see Materials and Methods). The haplogroup or D-loop clade (for Hg A) affiliation of clusters of sequences is shown in large empty characters. Aminoacid replacements are shown beside each branch in their polarized form. The Hg A portion of the network is magnified while the original network is in the inset. A large lozenge indicates the likely position of the root and was added in the drawing to partition three variants peculiar of Hg C. Their polarization was obtained by comparison with C. ibex.

