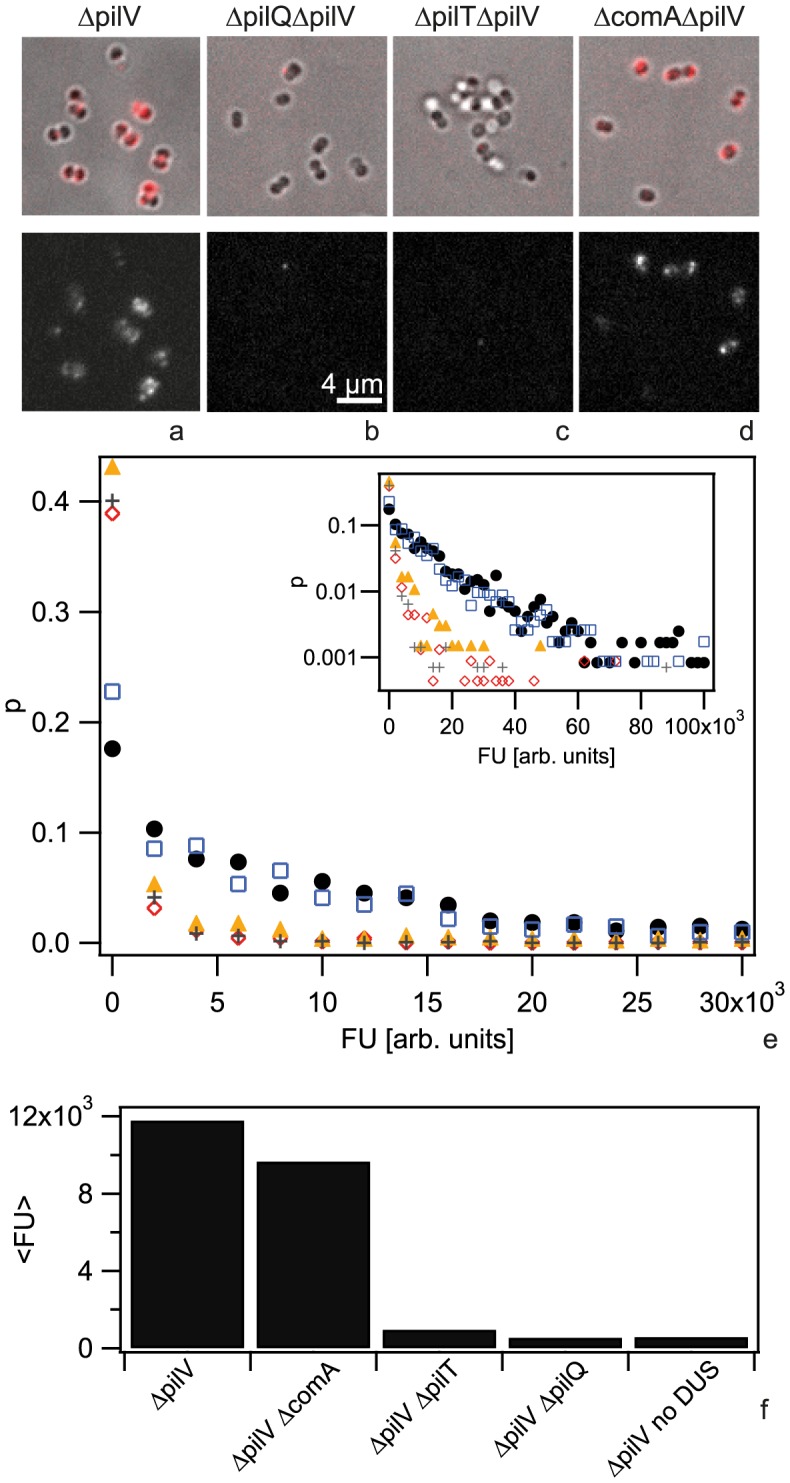
Figure 1. Cy3-DNA is imported into the periplasm.

Gonococci were incubated with Cy3-DNA for 30 min and subsequently treated with DNase. a,b,c,d) Upper line: merged images of brightfield and fluorescence, lower line: fluorescence images. a) ΔpilV, b) ΔpilQ ΔpilV, c) ΔpilT ΔpilV, d) ΔcomA ΔpilV. e) Probability distribution of single cell fluorescence with ΔpilV (black), ΔcomA ΔpilV (blue), ΔpilQ ΔpilV (red), ΔpilT ΔpilV (orange), ΔpilV no DUS (grey). Inset: logarithmic representation. f) Average fluorescence intensity. (N>500 for each condition).
