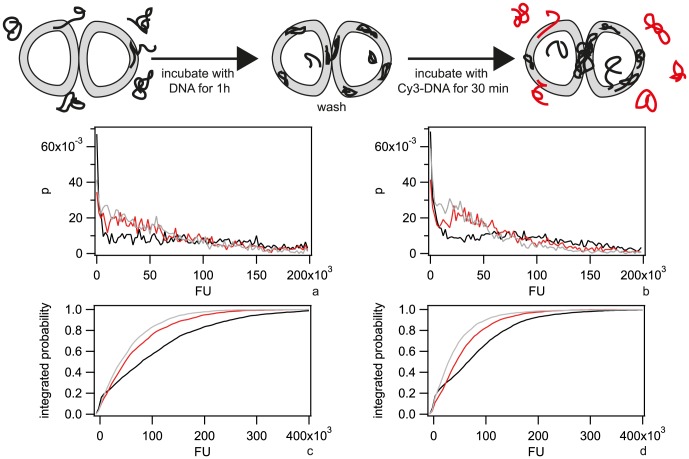
Figure 3. Pre-incubation with DNA inhibits uptake of Cy3-DNA.
a) Probability distribution of the total fluorescence intensity of individual ΔpilV cells after 30 min incubation with Cy3-DNA following incubation with no DNA (black), gDNA (red), 3 kbp fragments (grey). b) Probability distribution of the total fluorescence intensity of individual ΔcomA ΔpilV after 30 min incubation with Cy3-DNA following incubation with no DNA (black), gDNA (red), 3 kbp fragments (grey). c) and d) are the cumulative histograms of a) and b), respectively. (N>1000 for each condition).

