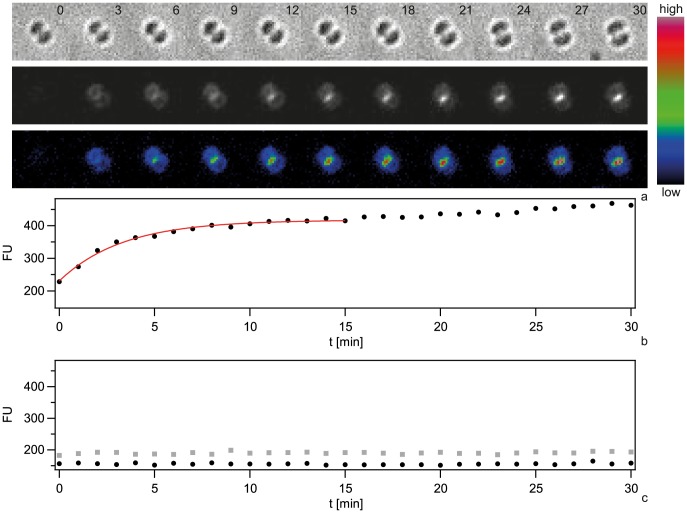
Figure 4. Dynamics of focus formation (ΔpilV) with 300 bp fragments of Cy3-DNA.
a) Time lapse of binding and import of Cy3-DNA. Upper line: brightfield image, middle line: fluorescence image, lower line: pseudocolored intensity image. Δt = 3 min. b) Black circles: Fluorescence intensities of cells shown in a. Red line: Exponential fit. c) Fluorescence intensities of individual ΔpilQ ΔpilV (black circles) and ΔpilT ΔpilV (grey boxes).

