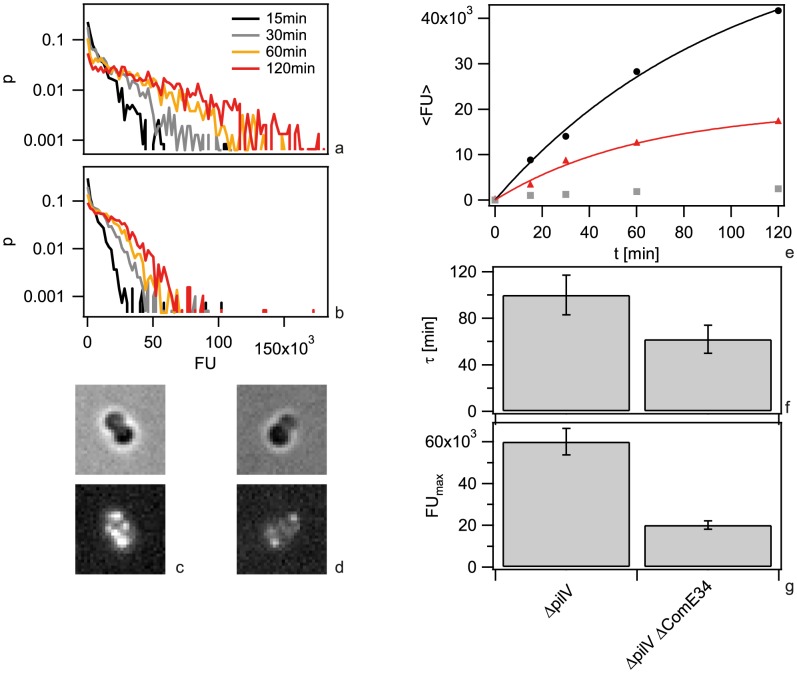
Figure 5. Dynamics of 3-DNA import depends on ComE.
a, b) Probability distribution of the total fluorescence intensity of individual a) ΔpilV and b) ΔcomE34 ΔpilV as a function of time. c, d) Typical fluorescence images after 1 h for c) ΔpilV and d) ΔcomE34 ΔpilV. e) Average fluorescence intensity per cell as a function of time with 3 kbp Cy3-DNA for ΔpilV (black circles), ΔcomE34 ΔpilV (red triangles), ΔcomE1234 ΔpilV (grey squares). Full lines: fits to exponential function. f) Saturation value for average fluorescence intensity per cell obtained from fits in e). g) Characteristic times obtained from fits in e). (N>1500 for each condition).

