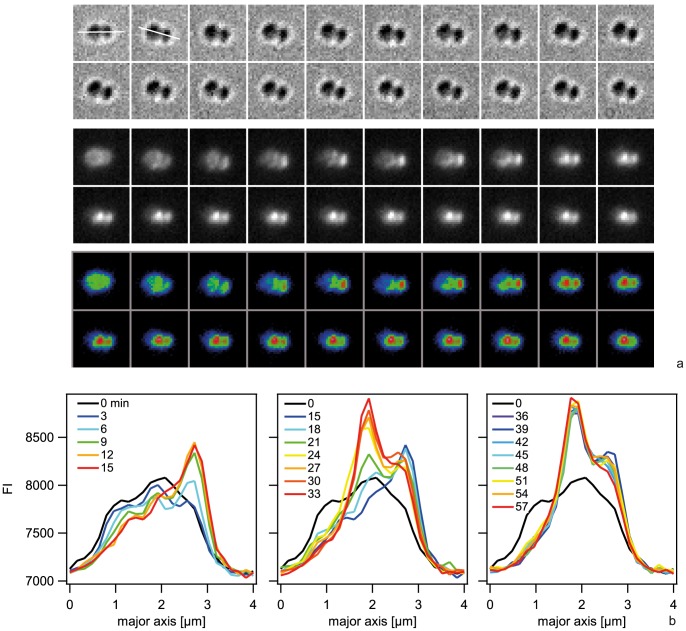
Figure 9. Spatio-temporal dynamics of ComE-mCherry upon addition of 10 kbp transforming DNA.
a) Time-lapse of ComE-mCherry dynamics. Upper line: brightfield image, middle line: fluorescence image, lower line: pseudocolored intensity image. The line denotes the major axis. Δt = 3 min. b) Intensity profiles through the major axis at different time points.

